Economy
Related: About this forumSP500 and econ reports - suspended. Last update was 6/9. If anything changes I will update the title
Last edited Wed Jul 8, 2026, 12:42 PM - Edit history (283)
so no point checking this thread to see if anything is new. It's been suspended due to health reasons that are eating up many dozens of hours a month since mid-April. I regret very much that I can't put time into this.
Everything below is the same as it was on 6/9/26.
TUESDAY 6/9/26
S&P 500: -0.50%, , DOW: +0.06% ( +32 points, ), , NASDAQ: -1.17%,
10Yr Treasury yield: 4.53% -0.02 (May 19's 4.67% was a 52-week high), ,
Bitcoin: $61,672 @ 711p ET, , , WTI OIL: $88.25
Stock market today: Dow rises, S&P 500, Nasdaq fall as tech rotation trade resumes, US-Iran tensions flare, Yahoo Finance, TUESDAY 6/9/26
https://finance.yahoo.com/markets/live/stock-market-today-dow-rises-sp-500-nasdaq-fall-as-tech-rotation-trade-resumes-us-iran-tensions-flare-225640873.html
(I'm skipping my customary excerpts, because, for now, all I have time for is a "I'm still alive" something-or-other)
Be sure to scroll down that page for many other informative articles for today
The S&P 500 closed Tuesday June 9 at 7387, down 0.3% for the day,
and up 27.7% from the 5783 election day closing level,
and up 23.2% from the inauguration eve closing level,
and up 25.6% since the December 31, 2024 close
and up 7.9% Year-To-Date (since the December 31, 2025 close)
and down 2.9% since its all-time closing high (7610 on June 2)
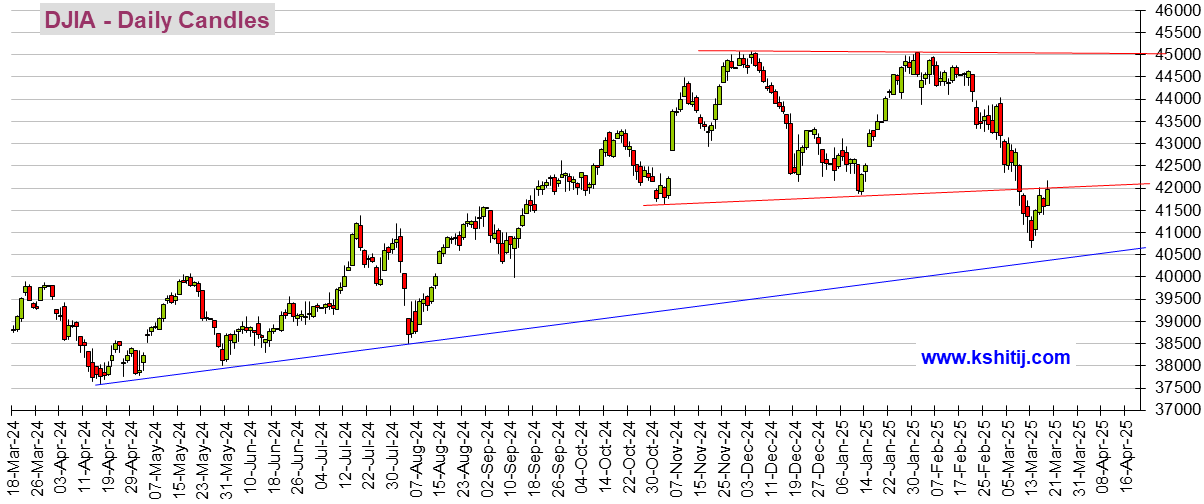
The Dow closed Monday at 50,786, and it closed Tuesday at 50,872, a rise of 0.2% (86 points) for the day
ADP weekly pulse of PRIVATE sector payroll jobs - this usually comes out every Tuesday with an exception for the week that the monthly ADP report comes out (usually 2 days before the BLS's "First Friday" Employment Situation report).
https://www.adpresearch.com/ NER Pulse: Week ending May 23, 2026, +29,000 jobs (+126,000 when expressed at a monthly rate). This is down from a local peak of +40,000 in the week ending May 2. Again these are PRIVATE SECTOR jobs, and don't include the government jobs. Remember that when comparing to the Bureau of Labor Statistic's "First Friday", "Employment Situation" that typically comes out on the first Friday of the month -- the BLS report's headline non-farm payroll jobs includes government jobs.
[TRADE BALANCE] US trade deficit narrows as oil exports surge
https://finance.yahoo.com/markets/article/the-us-trade-deficit-narrowed-in-april-as-oil-exports-surged-144538382.html
Yes, I should read it and provide a summary
[EXISTING HOME SALES]
Home sales jump in May
https://finance.yahoo.com/sectors/real-estate/article/home-sales-jumped-in-may-as-buyers-shrugged-off-higher-mortgage-rates-140017033.html
Yes, I should read it and provide a summary
Mortage delinquencies and foreclosures are rising, USA Today, 6/9/26
https://finance.yahoo.com/economy/articles/mortgage-delinquencies-foreclosures-rising-worrisome-143112273.html
Yes, I should read it and provide a summary
CPI (Consumer Price Index) to be released Wednesday, June 10. Economists surveyed by Bloomberg expect the Labor Department to report that consumer prices rose 0.5% from April and 4.2% from last May. FOUR PLUS PERCENT!
PPI (Producer Price Index, i.e. wholesale prices) to be released Thursday, June 11.
The rest of below is the same as what was here May 26
The rest of below is the same as what was here May 26
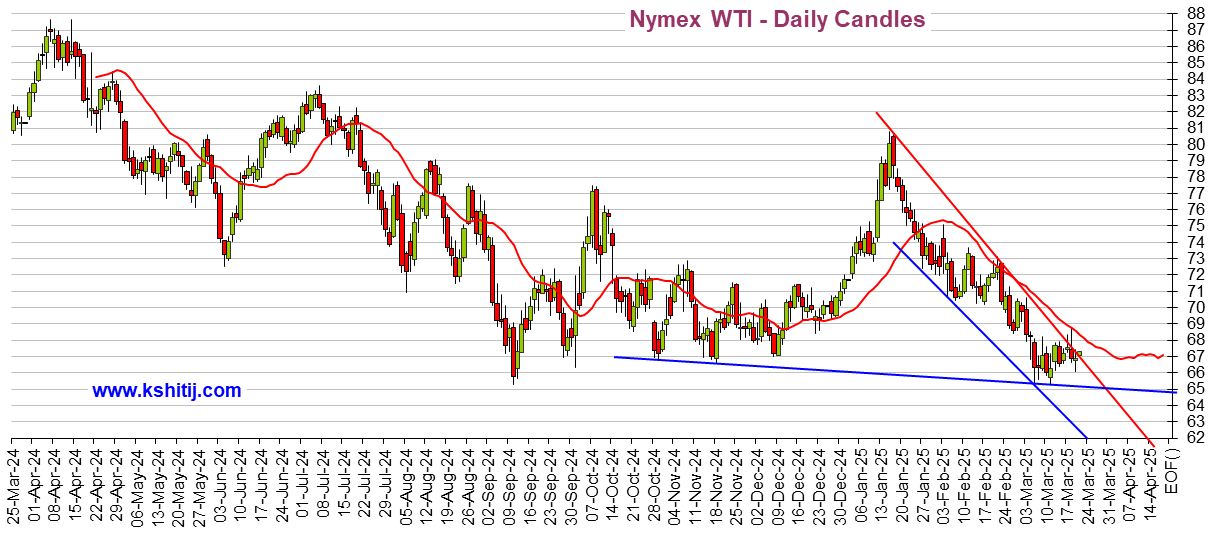
Oh, remember that the 3 graphs at the bottom of this page update on their own: Dow, Dollar, WTI Oil
5/26 status notes: I decided to drop some little thing for Tuesday 5/26 because it's been such a long time. Things are not going well health-wise and otherwise, so dunno what to tell you about updates anymore that is even slightly credible. I still haven't given up.
Behind the scenes I've been working on putting together a collection of the most informative reports, so for example, the best "First Friday" (Employment Situation) job report, the best ADP private payroll jobs report, the best CPI inflation report etc.. -- "best" means the one with the most generic links and explanatory material (not specific to any given week or month). They will be collected in a reply below yet-to-be-determined.
Anyway, so that people, and I, have easy access to the generically most informative ones (these reports won't have a particular week's or month's data, it's for finding out, for example, that the ADP private payrolls report is produced by a private payroll processing firm (so it's not a government report), that it is seasonally adjusted, that it is the PRIVATE sector (as opposed to the headline Bureau of Labor Statistics "First Friday" report which includes government jobs, and about what percent of all payroll jobs is private jobs and what percent are government jobs), that the report is at whatever link (how to find the latest at any time), that graphs are at whatever link, and so on. This will make it easier for me to write decent reports easily.
TUESDAY 5/26/26
S&P 500: +0.61%, , DOW: -0.23% ( -118 points, ), , NASDAQ: +1.19%, ,
10Yr Treasury yield: 4.49% -0.06 (Last Tuesday's 4.67% was a 52-week high), ,
Bitcoin: $75,898 @ 834p ET, , , WTI OIL: $93.11 -0.83%
Stock market today: S&P 500, Nasdaq jump to records as Micron tops $1 trillion market cap, Yahoo Finance, Tuesday 5/26/26
https://finance.yahoo.com/markets/live/stock-market-today-sp-500-nasdaq-jump-to-records-as-micron-tops-1-trillion-market-cap-112100210.html
(I'm skipping my customary excerpts, because, for now, all I have time for is a "I'm still alive" something-or-other)
Be sure to scroll down that page for many other informative articles for today
The S&P 500 closed Tuesday May 26 at 7519, up 0.6% for the day,
and up 30.0% from the 5783 election day closing level,
and up 25.4% from the inauguration eve closing level,
and up 27.8% since the December 31, 2024 close
and up 9.8% Year-To-Date (since the December 31, 2025 close)
The Dow closed Friday May 22 at 50,580, and it closed Tuesday at 50,462, a drop of 0.2% (118 points) for the day
Consumer Confidence, May
LBN THREAD (excellent, multiple graphs): https://www.democraticunderground.com/10143670628
U.S. Consumer Sentiment Worsened In May, Wall St Journal via MSN (no paywall, no gimmicks) - but one problem: It's mistitled (WSJ's mistake) it's the Consumer CONFIDENCE report, put out by the Conference Board, not to be confused with the Consumer SENTIMENT report, put out by the University of Michigan that came last Friday, May 22 https://www.democraticunderground.com/10143668631 , which showed that index to be at an all-time low, going back to 1961. The graph is a must-see ( https://www.democraticunderground.com/10143668631#post3 )
ADP weekly pulse of private payroll jobs - this usually comes out every Tuesday with an exception for the week that the monthly ADP report comes out (usually 2 days before the BLS's "First Friday" Employment Situation report). I was expecting one today, it's usually at https://www.adpresearch.com/ , but as of Tuesday, 5/26/26 9:24 P.M. EDT, it's still showing an old report that came out a week ago: +42,250 PRIVATE sector jobs in the week ending May 2. (Monthesizing, that's an 183,600 jobs/month rate).
LATER: WEDNESDAY 5/27 11:13 AM ET - it came out Wednesday (apparently Memorial Day Monday altered their schedule). The week ending May 2 was revised down to +40,750 PRIVATE SECTOR jobs a week, and today's report reported that the week ending May 9 is 35,750 PRIVATE SECTOR jobs a week, which monthesizes to a rate of 155,340/month. I like this graph: https://tradingeconomics.com/united-states/adp-employment-change-weekly
S&P Case-Shiller home price index (20 cities), March Actual: +0.7%, Previous: +0.8%
The above comes from the MarketWatch Calendar, https://www.marketwatch.com/economy-politics/calendar , and I don't know if this is a monthly change or a year-over-year change. From comparison with the link below,
Here's a link to what is the originator
https://www.spglobal.com/spdji/en/index-family/indicators/sp-cotality-case-shiller/sp-cotality-case-shiller-composite/#overview
https://www.spglobal.com/spdji/en/index-family/indicators/sp-cotality-case-shiller/sp-cotality-case-shiller-composite/#indices
It says the 20 cities index is up 1.04% over the past month, and 0.83% over the past year (12 months). The 0.83% doesn't quite agree with the Marketwatch Calendar 0.7% number, so life sucks and then you die. That's why writing these damn reports is not just a matter of scraping and pasting some media narrative.
The rest of below is the same as what was here May 18
The rest of below is the same as what was here May 18
5/18 status notes:
I've gotten so far behind and the week of 5/18-5/22 is very busy for me with necessary things needing taken care of.
Normally, when I'm not behind, updates take AT LEAST 7 hours a week, and involves finding some information on all the economic reports listed in the MarketWatch calendar ( https://www.marketwatch.com/economy-politics/calendar ) , and detailed look (far far beyond scraping and pasting media garbage) for the more important reports like the inflation reports, the big jobs "First Friday" report and ADP Payroll reports, Consumer Confidence and Consumer Sentiment (two different reports from two different organizations) and a few others. I just haven't had the time, and am not sure what to do going forward. I will be prioritizing the reports going forward.
Remember that the graphs at the bottom of the OP (Dow, Dollar, Oil) still automatically self-update, sometimes with a few hours delay, sometimes a couple days. (I've considering moving closer to the top or making a click away, since its about the only thing that's being kept up to date)
Oh, I did promise the May 13 PPI (Producer Price Index, aka Wholesale prices) which was a disaster (see this links for the graphs and table) --
https://www.democraticunderground.com/?com=view_post&forum=1014&pid=3664372
Percent increases over the past month, over the past 3 months, and over the past 12 months, seasonally adjusted numbers, ANNUALIZED
1 mo `3 mo `12mo
----- ----- -----
17.8% 11.1% 6.0% Regular PPI (includes food & energy)
`7.0% `5.3% 4.4% Core PPI (does not have food nor energy nor trade services)
2.0% 2.0% 2.0% Federal Reserve Target
backquote symbols (`) added for spacing. Please try to ignore them
LBN thread on the PPI report: https://www.democraticunderground.com/10143664341
5/5/26 and 5/11 and 5/12 status notes:
A lot of things just happened in the past week and had to take priority. Just so people don't wonder if I passed, or given up on this thread.
Most people know already that S&P 500 and NASDAQ are closing at new highs.
I added something on Tuesday's hot CPI inflation report in the calendar below.
I intend to put something here about Wednesday's PPI (producer price index aka wholesale inflation) report Wednesday. A full update with all the junk below cleaned up won't happens until Saturday 5/16.
I added "The Table" of S&P 500 vs. various benchmarks just below, as well as the to Yahoo Finance's May 11 and May 12 reports
Remember that the graphs at the bottom of the OP (Dow, Dollar, Oil) still automatically self-update, sometimes with a few hours delay, sometimes a couple days.
====== END STATUS NOTE 5/5/26 and 5/11 and 5/12 ==========
MONDAY 5/11/26
Stock market today: Dow rises, S&P 500 and Nasdaq eke out records as chip stocks extend gains, Yahoo Finance, Monday 5/11/26
https://finance.yahoo.com/markets/stocks/live/stock-market-today-monday-may-11-oil-rise-trump-rejects-peace-225625559.html
S&P 500: +0.19%, , DOW: +0.19% (+95 points), , NASDAQ: +0.10%, ,
10Yr Treasury yield: 4.41% +0.05 , , Bitcoin: $81,543 @928p ET, , , WTI OIL: $98.32 +0.26%
TUESDAY 5/12/26
Stock market today: Dow rises, S&P 500 and Nasdaq retreat on hot inflation print, tech sell-off, Yahoo Finance, 5/12/26
https://finance.yahoo.com/economy/live/stock-market-today-dow-rises-sp-500-and-nasdaq-retreat-on-hot-inflation-print-tech-sell-off-224350548.html
S&P 500: -0.16%, , DOW: +0.11% (+56 points), , NASDAQ: -0.71%, ,
10Yr Treasury yield: 4.46% +0.05 , , Bitcoin: $80,634 @727p ET, , , WTI OIL: $102.00 -0.18%
The S&P 500 closed Tuesday May 12 at 7401, down 0.2% for the day,
and up 28.0% from the 5783 election day closing level,
and up 23.4% from the inauguration eve closing level,
and up 25.8% since the December 31, 2024 close
and up 8.1% Year-To-Date (since the December 31, 2025 close)
The Dow closed Monday at 49,704, and it closed Tuesday at 49,761, a rise of 0.1% (56 points) for the day
The CPI inflation report and ADP weekly pulse report is in the Calendar below
MAY 4-8 WEEK'S CALENDAR (May 4 - May 8)
@@@@@@@@@@@@@@@@@@@@@@@@@@@@@@@@@@@@@@@@@@@@@@@@@@@@@@@@@@@
Time (ET) Report Period Actual Median Forecast Previous
MONDAY, May 4
10:00 am Factory orders March, Actual: 1.5%, Previous: 0.3%
TUESDAY, May 5
8:30 am U.S. trade balance March Actual: $60.3 Billion, Expected: -60.9 Billion, Previous: -$57.8 Billion -- yes, tat's what it says
9:45 am S&P final U.S. services PMI April Actual: 51.0, Expected: , Previous: 51.3
10:00 am Job openings March Actual: 6.87M , Expected: 6.80M , Previous: 6.92M
10:00 am New home sales* (delayed report) Feb. Actual: 635,000, Expected: 631,000, Previous: 583,000
10:00 am New home sales March Actual: 682,000, Expected: 660,000, Previous: 635,000
10:00 am ISM services April Actual: 53.6% , Expected: 54.3%, Previous: 54.0% (are these supposed to be in %'s ??)
WEDNESDAY, MAY 6
8:15 am ADP employment April, Actual: 109,000, Expected: 84,000, Previous: 61,000 (these are ADP's estimate of PRIVATE SECTOR net jobs increases)
THURSDAY, MAY 7
8:30 am Initial jobless claims week ending May 2 Actual: 200,000, Expected: 206,000, Previous: 190,000
8:30 am U.S. productivity Q1 Actual: 0.8% , Expected: 1.1% , Previous: 1.6%, These are quarterly numbers at an anuualized rate
10:00 am Construction spending* (delayed report) Feb. Actual: -0.2%, Expected: 0.1%, Previous: -1.9%
10:00 am Construction spending March Actual: 0.6% , Expected: 0.3%, Previous: -0.2%
3:00 pm Consumer credit March Actual: --- , Expected: $12.5 billion, Previous: $9.5 billion
FRIDAY, MAY 8
8:30 am U.S. employment report, headline non-farm payroll increases April Actual: 115,000 , Expected: 55,000, Previous: 185,000 , NOTE on the 115,000 -- yes, but the 2 previous months were revised downward by a combined 16,000, so the actual job gain was 99,000 compared to what was reported a month previously. Also (see https://finance.yahoo.com/economy/articles/us-employment-boom-maybe-maybe-185245547.html (in list above)) the number of employed people in the separate Household Survey has been greatly lagging the above-cited non-farm payroll jobs from the Establishment Survey
8:30 am U.S. unemployment rate April: Actual: 4.3%, Expected: 4.3%, Previous: 4.3%
8:30 am U.S. hourly wages April: Actual: +0.2% , Expected: +0.3%, Previous: +0.2% (these aren't adjusted for inflation)
8:30 am Hourly wages year over year, Actual: +3.6%, Expected: +3.8% , Previous: +3.4% (these aren't adjusted for inflation)
10:00 am Wholesale inventories March , Actual: 1.3%, Expected: 1.4%, Previous: 0.9%
10:00 am Consumer sentiment (prelim) May: Actual: 48.2 , Expected: 49.7 , Previous: 49.8
This is a new fresh all-time-low: https://finance.yahoo.com/economy/article/consumer-sentiment-hits-fresh-low-as-higher-gas-prices-drag-on-americans-outlooks-155315647.html
MAY 11-15 WEEK'S CALENDAR (May 11 - May 15)
@@@@@@@@@@@@@@@@@@@@@@@@@@@@@@@@@@@@@@@@@@@@@@@@@@@@@@@@@@@
Scraped Monday 5/11 752a, then Monday and Tuesday numbers updated for actuals
Time (ET) Report Period Actual Median Forecast Previous
MONDAY, May 11
Existing home sales April : Actual: 4.02 million , Expected: 4.1 M, Previous: 4.0M
Home sales edge up == https://finance.yahoo.com/economy/articles/us-existing-home-sales-increase-140150246.html
Home sales underwhelmed == https://finance.yahoo.com/sectors/real-estate/article/home-sales-underwhelmed-in-april-amid-elevated-mortgage-rates-and-economic-jitters-144632986.html
TUESDAY, May 12
NFIB optimism index April : Actual: 95.9, Expected: 96.2, Previous: 95.8
Consumer price index April
8:30 am Consumer price index (month-over-month) April: Actual: 0.6% , Expected: 0.6% , Previous: 0.9%
8:30 am CPI year over year: Actual: 3.8%, Expected: 3.8%, Previous: 3.3%
8:30 am Core CPI (month over month) April : Actual: 0.4%, Expected: 0.4%, Previous: 0.2%
8:30 am Core CPI year over year: Actual: 2.8%, Expected: 2.7%, Previous: 2.6%
LBN THREAD: https://www.democraticunderground.com/10143663939
GRAPHS and Table: https://www.democraticunderground.com/10143663939#post9
Percent increases over the past month, over the past 3 months, and over the past 12 months, seasonally adjusted numbers, ANNUALIZED
1 mo 3 mo 12mo
---- ---- ----
8.0% 7.3% 3.8% Regular CPI (includes food & energy)
4.6% 3.2% 2.8% Core CPI (does not have food or energy)
2.0% 2.0% 2.0% Federal Reserve Target
BLS news summary https://www.bls.gov/news.release/cpi.nr0.htm
Time? ADP weekly Pulse of PRIVATE SECTOR non-farm payrolls by ADP payroll processors: Actual: 33,000 week ending April 21 (I think that's the latest. This "monthesizes" to 143,000, Expected: , Previous:
https://www.adpresearch.com/
Monthly U.S. federal budget April : Actual: $215 billion, Expected: $217 billion , Previous: -$164 billion
WEDNESDAY, MAY 13
8:30 am Producer price index April : Actual: ___, Expected: 0.6% , Previous: 0.5%
8:30 am Core PPI April : Actual: ___, Expected: 0.3%, Previous: 0.2%
8:30 am PPI year over year: Actual: ___ , Expected: , Previous: 4.0%
8:30 am Core PPI year over year: Actual: ___, Expected: , Previous: 3.6%
THURSDAY, MAY 14
8:30 am U.S. retail sales April: Actual: ___, Expected: 0.5%, Previous: 1.7% (REMEMBER THESE ARE NOT ADJUSTED FOR INFLATION)
8:30 am Retail sales minus autos April: Actual: ___, Expected: 0.6%, Previous: 1.9%
8:30 am Initial jobless claims week ending May 9: Actual: ___, Expected: 205,000, Previous: 200,000
8:30 am Import price index April: Actual: ___ , Expected: 1.0%, Previous: 0.8%
8:30 am Import price index minus fuel April : Actual: ___ , Expected: , Previous: 0.6%
10:00 am Business inventories March : Actual: ___, Expected: 0.9%, Previous: 0.4%
FRIDAY, MAY 15
8:30 am Empire State manufacturing survey May: Actual: ___, Expected: 6.5, Previous: 11.0
9:15 am Industrial production April: Actual: ___ , Expected: +0.2% , Previous: -0.5%
9:15 am Capacity utilization April: Actual: ___, Expected: 75.8%, Previous: 75.7%
The full calendar: https://www.marketwatch.com/economy-politics/calendar
What's below is what's been there since 4/28.
The title line always has the closing price of the S&P 500, and the change since the previous close. I shortened it a bit to leave more room in the title line for mentions of key reports
I will be doing these only twice a week again: Tuesday and Friday (hah hah, promises promises. I still haven't given up on this goal).
10Y Treasury, in chronological order: It local-bottomed out at 3.95% Oct 22, 2025, its lowest point since April 2025. . 4.19% on Dec 2, 2025, , 4.27% on Feb 3, 2026, , 3.96% on Feb 27 (just before Iran War), , 4.12% on March 5, , 4.44% on Friday March 27, 4.31% on April 24
https://www.cnbc.com/quotes/US10Y (best) -or- https://finance.yahoo.com/quote/%5ETNX/
10 Year Treasury price: https://finance.yahoo.com/quote/ZN%3DF/
Bitcoin, In chronological order: It was $95,401 Jan 16, , $84,009 on Jan 30, , $75,512 on Feb 3, , $65,564 on Feb 27, , $71,357 on March 13 , , $74,580 March 17 $65,795 @ 440p ET, $77,592 @ 1129p ET April 24 ##### It's in bear market territory, down more than 20% from it's $126,000+ all-time high in October (20% down from $126,000 is $100,800) ACTUALLY, it's down 38% from $126,000 (Cryptocurrencies trade 24/7)
https://finance.yahoo.com/quote/BTC-USD/
Next Fed rate decision: THIS WEDNESDAY April 29 (last was March 18)
CME FedWatch tool (probabilities of various Fed interest rate moves) 4/24: 1% chance of a rate HIKE) and ZERO % chance of a rate cut
. . . https://www.cmegroup.com/markets/interest-rates/cme-fedwatch-tool.html
The Table -------- TUESDAY 4/28/26 -----
The S&P 500 closed Tuesday April 28 at 7139, down 0.5% for the day,
and up 23.4% from the 5783 election day closing level,
and up 19.0% from the inauguration eve closing level,
and up 21.4% since the December 31, 2024 close
and up 4.3% Year-To-Date (since the December 31, 2025 close)
The Dow closed Monday at 49,168, and it closed Tuesday at 49,142, a drop of 0.1% (26 points) for the day
ALL TIME HIGHS
The S&P 500's all-time closing high was 6978.6 on January 27 until surpassed April 15
The DOW's all-time closing high was 50,188 reached on February 10
The NASDAQ's all-time closing high was 23,857 reached on January 28 until surpassed in April
Market news of the day: https://finance.yahoo.com/
How to find the latest Yahoo Finance "stock market today" report if it's not at the finance.yahoo page (note that the headline displayed there does not include the "Stock Market Today" words, but the article itself does): click on
https://www.google.com/search?q=%22stock+market+today%22+site%3Afinance.yahoo.com&oq=%22stock+market+today%22+site%3Afinance.yahoo.com
If the link doesn't work for you,
Google: "stock market today" site:finance.yahoo.com
First I will very briefly cover Monday (just the link to the article), then on to Tuesday 4/28
--
Monday April 27
S&P 500: +0.12%, , DOW: -0.13% (-63 points), , NASDAQ: +0.20%, ,
TREASURY 10Yr: 4.34% +0.03 , , Bitcoin: $76,945 @ 420p ET , , WTI OIL: $96.42 +2.14%
Stock market today: S&P 500, Nasdaq notch fresh records, oil edges higher as markets weigh Iran peace odds, Yahoo Finance, Monday 4/27/26
https://finance.yahoo.com/markets/stocks/live/stock-market-today-monday-april-27-232226050.html
--- SCROLLING DOWN THE ABOVE YAHOO FINANCE PAGE, MONDAY, APRIL 27 -----
--- OTHER ARTICLES, MONDAY, APRIL 27 -----
This is a little older. But since the PCE inflation report comes out this Friday April 30, I'll leave it here for awhile
Inflation complications: The unusual gap between PCE and CPI is widening, Barron's (no paywall at this MSN-hosted article), 4/22/26
https://www.msn.com/en-us/money/markets/inflation-complications-the-unusual-gap-between-pce-and-cpi-is-widening/ar-AA21rnrB
Tuesday April 28
S&P 500: -0.49%, , DOW: -0.05% (-26 points), , NASDAQ: -0.90%, ,
TREASURY 10Yr: 4.35% +0.02 , , Bitcoin: $76,376 @ 422p ET , , WTI OIL: $99.63 +3.38%
Stock market today: Dow, S&P 500, Nasdaq drop as chip stocks sink on OpenAI report, oil rises, Yahoo Finance, Tuesday April 28
https://finance.yahoo.com/markets/stocks/live/stock-market-today-tuesday-april-28-dow-nasdaq-sp-oil-rises-earnings-in-focus-225503557.html
OpenAI has fallen short of its own targets for sales and users ahead of its highly anticipated IPO, the Wall Street Journal reported. Shares of partners such as Oracle (ORCL) slumped amid revived concerns about how long the AI spending boom will last.
Investors are now on high alert for clues to AI plans as the “Magnificent Seven” tech megacaps report quarterly results this week. Alphabet (GOOG), Amazon (AMZN), Meta (META), and Microsoft (MSFT) are on Wednesday’s docket, with Apple (AAPL) following the next day.
Meanwhile, the oil market is digesting news that the UAE is leaving the OPEC cartel, a move that deals a major blow to the bloc at an already historically precarious moment for Persian Gulf oil producers.
Wall Street is also watching for progress in peace talks, as the US-Iran standoff keeps traffic through the Strait of Hormuz at a standstill.
Brent crude (BZ=F) traded near $104 per barrel, while US WTI crude (CL=F) hovered near $100.
Also in focus, the Federal Reserve begins its two-day meeting on Tuesday. Policymakers are expected to hold rates steady in their decision on Wednesday, and investors will listen out for Fed Chair Jerome Powell’s comments as his term draws to a close.
--- SCROLLING DOWN THE ABOVE YAHOO FINANCE PAGE, TUESDAY, APRIL 28 -----
I have another time constraint situation, so I'm skipping this, unfortunately, since there are invariably a number of interesting articles
--- OTHER ARTICLES, TUESDAY, APRIL 28 -----
THESE SHOULD BE PUT IN THE REPORTS AND CALENDAR SECTION, BUT FOR NOW THEY ARE HERE
These are 3 reports that came out Tueday April 28, 2026
# Consumer confidence (Conference Board) :
https://finance.yahoo.com/economy/policy/article/consumer-confidence-ticks-higher-as-better-vibes-on-job-market-take-hold-144621322.html
Consumer confidence in April reached its highest level so far this year, according to a survey from the Conference Board.
The overall consumer confidence index climbed to 92.8 in April, up from March’s reading of 92.2 ... perceptions of the labor market improved (in the wake of the reported 178,000 net jobs added in March)
ULTIMATE SOURCE: https://www.conference-board.org/topics/consumer-confidence/
GRAPH:

It was a tiny uptick when you look at it on a graph.
# ADP PULSE -- ADP's weekly estimate of private sector job growth.
https://www.adpresearch.com/
Find the "The NER Pulse" section near the top, and click on Read More, resulting in:
https://www.adpresearch.com/the-power-of-mom-and-pops/
Scroll down the page for a graph
For the four weeks ending April 11, 2026, U.S. private employers added an average of 39,250 jobs a week ((which, when "monthesized" is a monthly rate of 170,541 -progree). It's slightly less than it was the week ending (W.E.) March 28 and also the week ending April 4 ( W.E. March 28 is the peak of the graph going back to W.E. Jan 24; W.E. March 28 is a bit over 40,000 from the graph). W.E. April 04 is slightly less that W.E. March 28. So there was a substantial downward revision from the initial W.E. April 4 report of an extraordinarily large 54,750 jobs a week (a 237,889 / month pace).
ADP is a private payroll processor that processes about 20% of the U.S. private payroll, and they estimate the other 80%. It is not a government report.
# S&P Case Shiller home price index (20 cities) February: +0.9% Y-O-Y (January was +1.2%). For the month, February was +0.44%.
https://www.spglobal.com/spdji/en/index-family/indicators/sp-cotality-case-shiller/
https://www.spglobal.com/spdji/en/index-family/indicators/sp-cotality-case-shiller/#indices
========EVERYTHING BELOW THIS POINT IS AS IT WAS FRIDAY APRIL 24, SORRY=======
I have time constraints today.
========EVERYTHING BELOW THIS POINT IS AS IT WAS FRIDAY APRIL 24, SORRY=======
=============================================
=============================================
=============================================
=============================================
REPORTS AND CALENDAR
Recent and Coming Up, Reports
https://www.marketwatch.com/economy-politics/calendar
See Reply #1 to this thread for last week's reports and older reports.
The government reports are all seasonally adjusted, as are most, if not all, of the non-government reports the media covers, so please don't post comments about how the numbers look good (or not as bad as expected) only because of Christmas season hires or Christmas shopping. Or that it's warming up and people are beginning spring shopping already -- seasonal factors like that have been adjusted for
THIS WEEK'S REPORTS/CALENDAR (Apr 20-24) FOLLOWED BY NEXT WEEK'S CALENDAR (Apr 27-May 1)
LAST WEEK'S REPORTS (APR 13 - 17)
@@@@@@@@@@@@@@@@@@@@@@@@@@@@@@@@@@@@@@@@@@@@@@@@@@@@@@@@@@@
These are all in Reply #1 in reverse chronological order. In a break from past practice, I am no longer putting last week's reports in this OP.
THIS WEEK'S REPORTS and CALENDAR (APR 20 - 24)
@@@@@@@@@@@@@@@@@@@@@@@@@@@@@@@@@@@@@@@@@@@@@@@@@@@@@@@@@@@
https://www.marketwatch.com/economy-politics/calendar
MONDAY APRIL 20 (REPORTS)
None scheduled
TUESDAY APRIL 21 (REPORTS)
#Record surge in gasoline receipts boosts US retail sales in March Reuters, 4/21/26
https://www.msn.com/en-us/money/markets/record-surge-in-gasoline-receipts-boosts-us-retail-sales-in-march/ar-AA21orii
(((March: +1.7%, February: +0.7%, 12 months: +4.0% -progree))
((Retail sales are not inflation-adjusted, so sometimes most or all and then some of the increase is due to the increase in prices -progree))
((CPI inflation: March: +0.9%, February: +0.3%, 12 months: +3.3%. So this time retail sales actually exceeded price increases. Simply subtracting the inflation from the retail sales increase, the after-inflation retail sales increases are roughly: March: +0.8%, February: +0.4%, 12 months: +0.7%. Kind of weak for 12 months -progree ))
February was revised up from +0.6% to 0.7%.
The Middle East conflict has sent global oil prices jumping more than 30%, with data from the U.S. Energy Information Administration showing retail gasoline prices soared 24.1% in March. . . .
Consumer Price Index increased 0.9% in March, with gasoline being the main driver of higher inflation.
The average tax refund was up $351 through March 27 compared to the same period in 2025, Internal Revenue Service data showed. The Treasury Department estimated that the average tax refund would be $1,000 higher compared to 2024.
From the Source: https://www.census.gov/retail/index.html -- > https://www.census.gov/retail/sales.html :
. . . Advance Retail Sales: Retail Trade and Food Services (Month-over-month) (MARTSMPCSM44X72USN), Not Seasonally Adjusted:
. . . . . . https://fred.stlouisfed.org/series/MARTSMPCSM44X72USN
. . . Advance Retail Sales: Retail Trade and Food Services (Month-over-month) (MARTSMPCSM44X72USS), Seasonally Adjusted:
. . . . . . https://fred.stlouisfed.org/series/MARTSMPCSM44X72USS
. . . Advance REAL Retail Sales: Retail Trade and Food Services (Month-over-month) Seasonally Adjusted -- I have not found this yet, until someone does, one has to calculate using the index values in series RRSFS below.
. . . Advance Retail Sales: Retail Trade and Food Services (RSAFS) (index values), seasonally adjusted
. . . . . . https://fred.stlouisfed.org/series/RSAFS
. . . Advance REAL Retail and Food Services Sales (RRSFS) (i.e. inflation adjusted) (index values), seasonally adjusted
. . . . . . https://fred.stlouisfed.org/data/RRSFS
(There are 52.14 weeks in a 365-day year, and 12 months).
The ultimate source: https://www.adpresearch.com/
It has a graph (scroll down half a page) showing it was about 15,000/week in mid-February -- https://www.adpresearch.com/the-rise-and-rise-of-knowledge-work/
(ADP is a private payroll processor that process about 20% of the U.S. private payroll, and they estimate the other 80%)
# Business inventories February, actual: +0.4%, expected: +0.3%, previous: +0.0%
https://www.msn.com/en-us/money/markets/us-pending-home-sales-beat-expectations-in-march/ar-AA21otG8
The pending home sales index rose 1.5% last month to 73.7, the National Association of Realtors said on Tuesday.
Pending home sales dropped 1.1% from a year earlier.
The popular 30-year fixed mortgage rate averaged 6.38% at the end of March, data from mortgage finance agency Freddie Mac showed. It had averaged 5.98% at the end of February, just before the war started, as Freddie Mac and Fannie Mae expanded purchases of mortgage-backed securities.
The NAR reported last week that existing home sales fell to a nine-month low in March.
A survey last week showed homebuilder sentiment plummeted to a seven-month low in April, noting that "energy costs make up approximately 4% of residential construction material input and service costs."
WEDNESDAY APRIL 22 (REPORTS)
None scheduled
THURSDAY APRIL 23 (REPORTS)
# Initial jobless claims week ending April 18, actual: 214,000, expected: 210,000, previous: 207,000
Reuters: +6,000 to 214,000 week ending 4/18. Continuing claims: +12,000 to 1.821M for the week ending 4/11. https://finance.yahoo.com/economy/articles/us-weekly-jobless-claims-increase-124003060.html
* SOURCE URL: The CURRENT one is always at: https://www.dol.gov/ui/data.pdf
This report's permalink: https://www.dol.gov/newsroom/releases/eta/eta20260423
* Permalinks for the current one and recent previous ones: https://www.dol.gov/newsroom/releases
. . . and search the page for "Unemployment Insurance Weekly Claims Report"
* The source URL has graphs, so one can see the trend over a year
Not-to-forget factoid from last week's report:
Reuters, 4/16/26 - https://finance.yahoo.com/news/us-weekly-jobless-claims-decline-123856207.html
***The so-called continuing claims have dropped from last year's lofty levels likely in part due to people exhausting their eligibility for benefits, limited to 26 weeks in most states. The data does not include some unemployed young workers, who typically have a limited or no work history. The job market for this group remains challenging.
# S&P flash U.S. services PMI April, actual: 51.3, expected: 51.0, previous: 49.8
(anything below 50 means contraction)
# S&P flash U.S. manufacturing PMI April, actual: 54.0, expected: 52.5, previous: 52.3
[S&P Global Flash] US business activity expands while prices rise most since 2022, Bloomberg, 4/23/26 == https://www.msn.com/en-us/money/markets/us-business-activity-expands-while-prices-rise-most-since-2022/ar-AA21ySEl
The S&P Global flash composite index rose 1.7 points to a three-month high of 52, data released Thursday showed. Figures above 50 indicate expansion. A measure of prices charged by manufacturers and service providers accelerated to the highest level since mid-2022.
. . . The Iran war also led to greater supply constraints for factories, with lead times on supplier deliveries stretching to the longest since August 2022 and materials costs accelerating. The measure of input prices for manufacturers grew at the fastest rate in nearly a year.
Businesses are quickly passing those costs along, as the composite measure of selling prices increased to 59.9, the highest since July 2022.
“Not surprisingly, prices are already spiking higher in this environment, and not just for energy but for a wide variety of goods and services. The overall inflation picture is now the most worrying for almost four years,” said Williamson.
Meanwhile, service sector activity recovered from last month's contraction, though remains subdued. A measure of new business slid to a two-year low.
FRIDAY APRIL 24 (REPORTS)
# Consumer sentiment (FINAL) April,
# Consumer sentiment final reading (49.8 in April) - has a graph -- Consumer sentiment at record low as Americans feel impact of war in Iran, Yahoo Finance, 4/24/26
https://finance.yahoo.com/news/consumer-sentiment-at-record-low-as-americans-feel-impact-of-war-in-iran-142920073.html
# LBN thread on consumer sentiment - https://www.democraticunderground.com/10143655889
The title of the thread says it's near a 4-year low, but they (Reuters via U.S. News) later changed the title to say it was at a record low.
https://money.usnews.com/investing/news/articles/2026-04-24/us-consumer-sentiment-drops-to-near-four-year-low-in-april
NEXT WEEK'S CALENDAR (APR 27-May 1)
@@@@@@@@@@@@@@@@@@@@@@@@@@@@@@@@@@@@@@@@@@@@@@@@@@@@@@@@@@@
https://www.marketwatch.com/economy-politics/calendar
The Fed's interest rate decision is Wednesday April 29
Thursday April 30 is busy with the PCE inflation (the Fed's favorite inflation gauge), personal income and expenditures, Q1 GDP 1st estimate, leading economic indicators, and unemployment insurance claims,
MONDAY, APRIL 27 (CALENDAR)
None scheduled
TUESDAY, APRIL 28 (CALENDAR)
9:00 am S&P Case-Shiller home price index (20 cities) February, Previous: 1.2%
10:00 am Consumer confidence April, Expected: 89.1, Previous: 91.8
WEDNESDAY, APRIL 29 (CALENDAR)
8:30 am Durable-goods orders March, Expected: 0.5%, Previous: -1.4%
8:30 am Durable-goods minus transportation March, Previous: 0.8%
8:30 am Housing starts (delayed report) February, Expected: 1.35 million, Previous: 1.49 million
8:30 am Building permits (delayed report) February, Previous: 1.38 million
8:30 am Housing starts March, Expected: 1.38 million --
8:30 am Building permits March, Expected: 1.39 million --
8:30 am Advanced U.S. trade balance in goods March, Previous: 83.5 billion
8:30 am Advanced retail inventories March, -- Previous: 0.2%
8:30 am Advanced wholesale inventories March, -- Previous: 0.8%
2:00 pm FOMC interest-rate decision
THURSDAY, APRIL 30 (CALENDAR)
8:30 am Initial jobless claims April 25, Expected: 215,000, Previous: 214,000
8:30 am Employment cost index Q1, Expected: 0.9% Previous: 0.7%
8:30 am GDP Q1 Expected: 2.4%, Previous: 0.5%
8:30 am Personal income March, Expected: 0.3%, Previous: -0.1%
8:30 am Personal spending March, Expected: 0.9%, Previous: 0.5%
8:30 am PCE inflation index March, Expected: 0.7%, Previous: 0.4%
8:30 am PCE (year-over-year), Expected: 3.5%, Previous: 2.8%
8:30 am Core PCE index March, Expected: 0.3%, Previous: 0.4%
8:30 am Core PCE (year-over-year), Expected: 3.2%, Previous: 3.0%
9:45 am Chicago Business Barometer (PMI) April, -- Previous: 52.8
10:00 am U.S. leading economic indicators February, -- Previous: -0.1%
FRIDAY, May 1 (CALENDAR)
9:45 am S&P U.S. manufacturing PMI April, -- Previous: 55.7
10:00 am ISM manufacturing April, Expected: 52.9, Previous: 52.7
####### -.CAL #########
The full calendar: https://www.marketwatch.com/economy-politics/calendar
Revised release dates for Bureau of Labor Statistics reports: https://www.bls.gov/bls/2025-lapse-revised-release-dates.htm
BEA.GOV news release schedule (they produce reports on the GDP, Retail Sales, PCE Inflation (the Fed's favorite inflation gauge), and Personal Consumption and Income: https://www.bea.gov/news/schedule
ADP NER Pulse (private payrolls weekly update): Is every Tuesday. The ultimate source: https://www.adpresearch.com/
and look for "NER Pulse"
Archives of previous reports
The monthly payroll employment reports from the BLS are archived at Archived News Releases (https://www.bls.gov/bls/news-release/ ). In the list up at the top, under Major Economic Indicators, select Employment Situation ( https://www.bls.gov/bls/news-release/empsit.htm ) . That opens up links to reports going back to 1994. (Includes CPI, ECI, many others)
Unemployment insurance claims archives: https://oui.doleta.gov/unemploy/claims.asp . If that doesn't work, start with https://oui.doleta.gov/unemploy/claims_arch.asp and click on "Weekly Claims Data" near the very bottom.
BEA's Data Archive https://www.bea.gov/news/archive
=============================================
=============================================
=============================================
=============================================
The S&P 500 closed Friday April 24 at 7165, up 0.8% for the day, to a new all-time high
and up 23.9% from the 5783 election day closing level,
and up 19.5% from the inauguration eve closing level,
and up 21.8% since the December 31, 2024 close
and up 4.7% Year-To-Date (since the December 31, 2025 close)
# Election day close (11/5/24) 5783
# Last close before inauguration day: (1/17/25): 5997
# 2024 year-end close (12/31/24): 5882
# Trump II era low point (going all the way back to election day Nov5): 4983 on April 8
# 2025 year-end close (12/31/25): 6845
# October 28 all-time-high: 6890.90, surpassed by December 24's all-time high of 6932.00 surpassed by ...
# Several market indexes: https://finance.yahoo.com/
# S&P 500: https://finance.yahoo.com/quote/%5EGSPC/
https://finance.yahoo.com/quote/%5EGSPC/history/
# S&P 500 futures: https://finance.yahoo.com/quote/ES%3DF/
Bitcoin
Bitcoin ended 2024 at $93,429. https://finance.yahoo.com/quote/BTC-USD/
Bitcoin's all-time interday high: 126,198 on Oct. 6
Bitcoin's all-time closing high: 124,753 on Oct 6. (that's what Yahoo Finance shows, but cryptocurrencies trade 24/7)
https://finance.yahoo.com/quote/BTC-USD/history/
========================================================
I'm not a fan of the DOW as it is a cherry-picked collection of just 30 stocks that are price-weighted, which is silly. It's as asinine as judging consumer price inflation by picking 30 blue chip consumer items, and weighting them according to their prices. But since there is an automatically updating embedded graphic, here it is. It takes several, like 6 hours, after the close for it to update, like about 10 PM EDT.
(If it still isn't updated, try right-clicking on it and opening in a new tab. #OR# click on https://finance.yahoo.com/quote/%5EDJI/ ).
The Dow closed Thursday at 49,310, and it closed Friday at 49,231, a drop of 0.2% (80 points) for the day
https://finance.yahoo.com/
DOW: https://finance.yahoo.com/quote/%5EDJI/
. . . . . . https://finance.yahoo.com/quote/%5EDJI/history/
DOW
# Election day close (11/5/24) 42,222
# Last close before inauguration day: (1/17/25): 43,488
# 2024 year-end close (12/31/24): 42,544
# 2025 year-end close (12/31/25): 48,063
DJIA means Dow Jones Industrials Average. It takes about 6 hours after the close to update, so check it after 10 PM EDT. Sometimes it takes a couple days (sigh)
I don't have an embeddable graph for the S&P 500, unfortunately, but to see its graph, click on https://finance.yahoo.com/quote/%5EGSPC/
While I'm at it, I might as well show Oil and the Dollar:
Crude Oil
US Dollar Index (DX-Y.NYB)
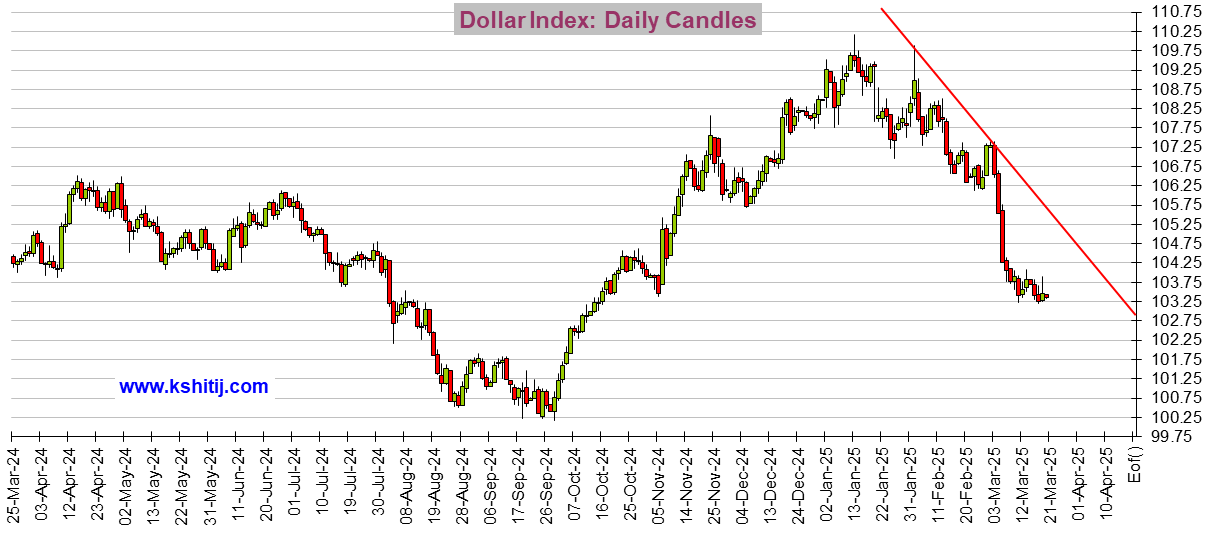
If you see a tiny graphics square above and no graph, right click on the square and choose "load image". There should be a total of 3 graphs. And remember that it typically takes about 6 hours after the close before these graphs update.
🚨 ❤️ 😬! 😱 < - - emoticon library for future uses
 = new reply since forum marked as read
Highlight:
NoneDon't highlight anything
5 newestHighlight 5 most recent replies
= new reply since forum marked as read
Highlight:
NoneDon't highlight anything
5 newestHighlight 5 most recent replies

progree
(13,131 posts)Last edited Wed Apr 22, 2026, 03:41 AM - Edit history (16)
Most Recent First (reverse chronological order)THURSDAY APRIL 16 (REPORTS)
# Initial jobless claims Week ending April 11 , 207,000, Previous week: 218,000
Continuing claims rose 31,000 to 1.818 million for the week ending April 4.
Reuters - https://finance.yahoo.com/news/us-weekly-jobless-claims-decline-123856207.html
***The so-called continuing claims have dropped from last year's lofty levels likely in part due to people exhausting their eligibility for benefits, limited to 26 weeks in most states. The data does not include some unemployed young workers, who typically have a limited or no work history. The job market for this group remains challenging.
# Philadelphia Fed manufacturing survey, April: 26.7 Previous month: 18.1
# Industrial production in March fell 0.5% Previous month: +0.2%
https://www.federalreserve.gov/releases/g17/current/default.htm
Industrial production (IP) dropped 0.5 percent in March but still grew at an annual rate of 2.4 percent in the first quarter. Similarly, manufacturing output ticked down 0.1 percent in March yet grew at a 3.0 percent rate in the first quarter.
At 101.8 percent of its 2017 average, total industrial production was 0.7 percent above its year-earlier level.
# Capacity utilization in March: 75.7% Previous month: 76.1%
https://www.federalreserve.gov/releases/g17/current/default.htm
Capacity utilization receded to 75.7 percent, a rate that is 3.7 percentage points below its long-run (1972–2025) average.
WEDNESDAY APRIL 15 (REPORTS)
#Import price index March +0.8% Previous month: +0.9%
That's a lot, it seems to me.
#Empire State manufacturing survey April
# Fed Beige Book democraticunderground.com/10143651155 https://www.federalreserve.gov/monetarypolicy/files/BeigeBook_20260415.pdf
https://www.msn.com/en-us/money/markets/fed-s-beige-book-shows-iran-war-has-economy-on-edge/ar-AA20YK6c
TUESDAY APRIL 14 (REPORTS)
# ADP Pulse: For the four weeks ending March 28, 2026, U.S. private employers added an average of 39,250 jobs a week, Tuesday, 4/14/26
Multiplying by 52.14/12 to "monthesize it" to the average month: 170,551
(There are 52.14 weeks in a 365-day year, and 12 months).
The ultimate source: https://www.adpresearch.com/
It has a graph (scroll down half a page) showing it was about 15,000/week in mid-February -- https://www.adpresearch.com/what-small-employers-are-telling-us-about-the-labor-market/
(ADP is a private payroll processor that process about 20% of the U.S. private payroll, and they estimate the other 80%)
#PPI (wholesale price inflation) not as hot as expected but hot, 4/14/26
The media is making it out to be "cool" and "cooling", but that is a crock of crap, as one can see from the graphs https://www.democraticunderground.com/10143649973#post3 and the table below
Percent increases, seasonally adjusted numbers, ANNUALIZED, over the following 3 periods
Past ` Past 3 ` Past 12
month `months ` months
----- -------- --------
6.3% ` 6.4% ` ` 4.0% Regular PPI (includes food & energy & trade services)
2.5% ` 4.8% ` ` 3.6% Core PPI (does not have food, energy, or trade services)
2.0% ` 2.0% ` ` 2.0% Federal Reserve Target
` symbols are used for spacing. Please ignore them
Also, the PPI's 12 month (year-over-year) increase of 4.0% is the highest in 3 years
MONDAY APRIL 13 (REPORTS)
# US existing home sales drop to nine-month low in March amid tight supply, Yahoo Finance, 4/13/26
https://finance.yahoo.com/news/us-existing-home-sales-drop-140547993.html
Home sales dropped 3.6% last month to a seasonally adjusted annual rate of 3.980 million units, the lowest level since June 2025, the National Association of Realtors said on Monday.
Existing-home sales decreased by 3.6% in March 2026. Month-over-month sales fell in all regions. Year-over-year sales rose in the South and West and declined in the Northeast and Midwest.
https://www.nar.realtor/research-and-statistics/housing-statistics/existing-home-sales
FRIDAY APRIL 10 (REPORTS)
# Hot CPI Inflation report for MARCH, Friday, 4/10/26
https://www.democraticunderground.com/10143647448
March was +0.9% over February, an astonishing 10.8% annualized. Year-over-year: 3.3%
For the core CPI, it was +0.2% over February, and a 2.6% year-over-year increase.
# Factory orders February: 0.0%. Previous month: 0.0%
# Consumer Sentiment lowest on record last 66 years, April preliminary, 4/10/26
https://www.democraticunderground.com/10143647510
THURSDAY APRIL 9 (REPORTS)
# Personal income in February was down 0.1%. In the previous month it was up 0.4%
I don't think these are inflation-adjusted. The CPI inflation in February was +0.3% over January.
SOURCE URLS: 4/9/26 release: https://www.bea.gov/data/income-saving/personal-income
. . . CURRENT RELEASE - https://www.bea.gov/news/2026/personal-income-and-outlays-february-2026
. . . FULL RELEASE AND TABLES - UPDATE THIS: https://www.bea.gov/sites/default/files/2026-03/pi0126.pdf
. . . . . . I can't find the equivalent of this one for this month's report, I'll have to dig. I saw something where they have eliminated PDF versions to reduce duplication.
# Personal spending in February was up 0.5%. In the previous month is was up 0.3%
I don't think these are inflation-adjusted. The CPI inflation in February was +0.3% over January.
See Personal income above for links to the source.
# [PCE] Core inflation was 3% in FEBRUARY as expected, key Fed gauge shows (this before the Iran war), 4/9/26
https://www.democraticunderground.com/10143646849
(It really was a hot report, as I yammer on at length in the thread, see graphs in the thread)
SOURCE URLS: 4/9/26 release: https://www.bea.gov/data/income-saving/personal-income
. . . CURRENT RELEASE - https://www.bea.gov/news/2026/personal-income-and-outlays-february-2026
. . . PCE DATA SERIES: https://fred.stlouisfed.org/series/PCEPI
. . . CORE PCE DATA SERIES: https://fred.stlouisfed.org/data/PCEPILFE
# GDP (second revision) Q4: +0.5% at an annualized rate. This is down from the first estimate of +0.7%
#US economy grew a sluggish 0.5% in fourth quarter ((at an annualized rate -Progree)), government says, downgrading previous estimate, 4/9/26
https://www.democraticunderground.com/10143646858
# Initial jobless claims for the week ending April 4: 219,000. Previous week: 203,000
WEDNESDAY APRIL 8 (REPORTS)
# Minutes of Fed's March FOMC meeting
TUESDAY APRIL 7 (REPORTS)
# Durable-goods orders down 1.4% in February. Previous month: down 0.5%
MONDAY APRIL 6 (REPORTS)
# ISM Services in March: 54.0%. Previous month: 56.1%
FRIDAY APRIL 3 (REPORTS)
# 178,000 Net new jobs added in March, unemployment rate edges down from 4.4% to 4.3%, 4/3/2026
https://www.democraticunderground.com/10143643223
Sounds wonderful, but this recent Economy thread's graph puts it in perspective:
For 10 straight months, monthly job growth has alternated between positive and negative - excellent graph
https://www.democraticunderground.com/1116101897
# Average hourly wages up 0.2% in March, 3.5% year-over-year
This is part of the employment situation report, aka "First Friday" that produces the headline non-farm payroll numbers and unemployment rate.
In March, the Consumer Price Index (CPI) was 0.9% higher than in February, and 3.3% year-over-year. https://www.democraticunderground.com/10143647448
# S&P final U.S. services PMI, March 49.8 , Previous month: 51.7
THURSDAY APRIL 2 (REPORTS)
# Initial jobless claims week ending March 28 202,000 (Previous week: 211,000)
# U.S. trade deficit February $57.3 billion Previous month: $54.7 billion
The U.S. trade deficit widened by 4.9% to $57.3 billion in February 2026, driven by a rebound in imports that outpaced record-high exports, according to the April 2 report from the Commerce Department and Bureau of Economic Analysis (BEA) https://www.bea.gov/news/2026/us-international-trade-goods-and-services-february-2026 .
WEDNESDAY APRIL 1 (REPORTS)
# ADP National Employment Report – Private sector employment increased by 62,000 jobs in March and pay was up 4.5 percent year-over-year according to the March ADP National Employment Report , 4/1/26
https://adpemploymentreport.com
ADP is a private payroll processing firm that processes payrolls for 20% of the private sector payroll employed, and estimates somehow the other 80%
# Retail sales (delayed report) increased 0.6% in February (these figures are not inflation-adjusted, so some of the increase is simply due to higher prices),
# S&P final U.S. manufacturing PMI March 52.3 (52.4 was expected, previous period was 51.6)
# ISM manufacturing, March 52.7% (52.1 was expected, previous period was 52.4)
TUESDAY MARCH 31 (REPORTS)
# S&P Cotality Case-Shiller home price index (20 cities) January 1.2% 1.3% 1.4%
# Job openings (JOLTS - Job Openings Labor Turnover Survey) February 6.9 million 6.9 million 7.2 million
# Consumer confidence, Conference Board, March, 91.8 , Expected: 87.5 Previous: 91.0
FRIDAY MARCH 27 (REPORTS)
# Consumer Sentiment: Consumer sentiment hits lowest level since December, Yahoo Finance, 3/27/26 https://www.democraticunderground.com/10143639684
The Index of Consumer Sentiment showed sentiment ended March with a final reading of 53.3, ... the lowest reading in three months. Overall, consumer sentiment fell 5.8% from February and 6.5% from a year ago.
Interviews for this release were collected between February 17 and March 23, with about two-thirds completed after the start of the US military conflict in Iran.
10 Year Consumer Sentiment: https://www.sca.isr.umich.edu/files/chicsr.pdf
50 years: https://www.sca.isr.umich.edu/files/chicsh.pdf
THURSDAY MARCH 26 (REPORTS)
# Unemployment insurance claims - +5,000 to 210,000. ## [Continuing claims:] The advance number for seasonally adjusted insured
unemployment during the week ending March 14 was 1,819,000, a decrease of 32,000 from the previous week's revised
level. This is the lowest level for insured unemployment since May 25, 2024 when it was 1,804,000. The previous week's level was revised down by 6,000 from 1,857,000 to 1,851,000.
https://www.dol.gov/ui/data.pdf
Mortgage rates surge to 7 month high
https://finance.yahoo.com/personal-finance/mortgages/article/mortgage-rates-surge-to-7-month-high-as-buyer-confidence-shaken-mortgage-and-refinance-interest-rates-today-100000556.html
WEDNESDAY MARCH 25 (REPORTS)
# Import price index, February
US import prices post largest gain in four years as energy costs soar
(Jan: +0.6%, Feb: +1.3%, there's a month-by-month bar graph, only a 1.3% YOY increase. "import prices, which exclude tariffs" ), Reuters, 3/25/26
U.S. import prices increased by the most in nearly four years in February as energy costs surged in anticipation of conflict in the Middle East, adding to signs that inflation is poised to accelerate in the months ahead.
Import prices jumped 1.3% last month, the largest increase since March 2022, after an upwardly revised 0.6% gain in January, the Labor Department's Bureau of Labor Statistics said on Wednesday. Economists polled by Reuters had forecast import prices, which exclude tariffs, increasing 0.5% after a previously reported 0.2% rise in January.
In the 12 months through February, import prices advanced 1.3%. That was the largest year-on-year increase since February 2025, and followed a 0.3% increase in January.
TUESDAY MARCH 24 (REPORTS)
# 8:30 am U.S. productivity (revision) Q4 2.8%
Labor cost surprise lands at bad time for treasuries, Seeking Alpha, 3/24/26 == https://www.msn.com/en-us/money/markets/labor-cost-surprise-lands-at-bad-time-for-treasuries/ar-AA1ZjuhP
Adding to existing stagflation fears, fresh data from the Bureau of Labor Statistics showed Q4 nonfarm labor productivity ( https://seekingalpha.com/news/4567791-productivity-revised-lower-to-18-in-q4-while-labor-costs-revised-higher ) was revised down to a 1.8% annualized clip from 2.8% as hours worked declined again, while unit labor costs were revised markedly higher to 4.4% from 2.8%.
# S&P flash U.S. services PMI March
S&P flash U.S. manufacturing PMI March
# US business activity slips to 11-month low in March amid Iran war, S&P Global survey shows, 3/24/26 (flash PMI)
https://www.democraticunderground.com/10143637971
S&P Global said its flash U.S. Composite PMI Output Index, which tracks the manufacturing and services sectors, fell to 51.4 this month. That was the lowest level since last April and followed a 51.9 reading in February.
# ADP Pulse - For the four weeks ending March 7, 2026, U.S. private employers added an average of 10,000 jobs per week, according to the NER Pulse, a weekly update of the monthly ADP National Employment Report (NER).
https://mediacenter.adp.com/2026-03-24-ADP-National-Employment-Report-Preliminary-Estimate-for-March-7,-2026
Multiplying by 52.14/12 to "monthesize it" to the average month: 43,452
. . . (There are 52.14 weeks in a 365-day year, and 12 months)
The ultimate source: https://www.adpresearch.com/
and look for "NER Pulse"
MONDAY MARCH 23 (REPORTS)
# 10:00 am Construction spending (delayed report) Jan. 0.3%
THURSDAY MARCH 19 (REPORTS)
8:30 am Initial jobless claims March 14
# US applications for jobless benefits fall to 205,000 last week as layoffs remain historically low, AP, 3/19/26
https://www.msn.com/en-us/money/markets/us-applications-for-jobless-benefits-fall-to-205-000-last-week-as-layoffs-remain-historically-low/ar-AA1YYR7a?ocid=msedgntp&pc=U531&cvid=69bc004a68e647cf87e1322dd11785b5&ei=28
8:30 am Philadelphia Fed manufacturing survey March -- Previous report: 16.3
I'd dig up a link, but it's taxes fortnight
10:00 am Wholesale inventories January -- Previous report: 0.2%
I'd dig up a link, but it's taxes fortnight
10:00 am New home sales January (note the JANUARY)
US new home sales drop to near 3-1/2-year low in January, Reuters, 3/19/26
https://archive.ph/w2aEJ
New home sales tumbled 17.6% to a seasonally adjusted annualized rate of 587,000 units, the lowest level since October 2022, the Commerce Department's Census Bureau said on Thursday.
Data for December was revised lower to show sales falling to a pace of 712,000 units instead of the previously reported 745,000 unit rate. Economists had expected home sales to fall to a rate of 720,000 units in January. Sales dropped in all four regions.
New home sales account for a small share of U.S. home sales and tend to be volatile on a month-to-month basis.
WEDNESDAY MARCH 18 (REPORTS)
# Producer price index February (It was hot 0.5% month-over-month growth in January)
# LBN Thread: https://www.democraticunderground.com/10143634448
# BLS SOURCE: https://www.bls.gov/news.release/ppi.nr0.htm
# PPI http://data.bls.gov/timeseries/WPSFD4
# PPI ex food, energy, and trade services http://data.bls.gov/timeseries/WPSFD49116
# PPI ex food & energy http://data.bls.gov/timeseries/WPSFD49104
# Note that the BLS never uses the term "core" anywhere in the news release ppi.nr0.htm
# See also Table 1 in ppi.nr0.htm: https://www.bls.gov/news.release/ppi.t01.htm
Trade Services month-over-month percentage increases in the last 5 months were:
. . . -0.9% -0.5% +1.9% +2.2% +0.4%.
12 months: +5.2%
I annualize everything for comparisons to each other and to the 2% Federal Reserve inflation goal
One month increase (month-over-month) (annualized)
. REGULAR CORE MONTH
PPI 8.5% 6.5% FEB (PPI = wholesale prices)
CPI 3.2% 2.6% FEB
PCE 3.3% 4.4% JAN
GOAL 2.0% 2.0%
Average increase over last 3 months (annualized):
. REGULAR CORE MONTH
PPI 6.6% 4.5% FEB (PPI = wholesale prices)
CPI 3.0% 3.0% FEB
PCE 3.5% 3.7% JAN
GOAL 2.0% 2.0%
The above really puts in perspective how hot Wednesday's PPI report is (March 18). They are all bad, but the PPI is at a special level of bad.
The PPI Core is the regular PPI but without food, energy, and trade services
All 3 inflation sets of graphs (PPI, PCE, CPI) are at the top of my journal, one right after the other
both regular and core measures
https://www.democraticunderground.com/~progree
-For permanence, the graphs' links -
PPI (Feb): https://www.democraticunderground.com/?com=view_post&forum=1014&pid=3634503
PCE (Jan.): https://www.democraticunderground.com/?com=view_post&forum=1014&pid=3631734
CPI (Feb.): https://www.democraticunderground.com/?com=view_post&forum=1014&pid=3630564
The links to the data are in those posts
They show that inflation is RISING. It is not "easing", nor is it just "sticky".
NOTE: the PCE graphs (and the table line for it) are for JANUARY, which is the latest PCE report to date.
The CPI and PPI (wholesale prices) are for February
All of this of course is before the US/Israeli attack on Iran on February 28.
--END PPI Report--------------------------------
Factory orders January
I thought I had a link. Anyway, it's for January, so I won't bother to hunt one down (taxes fortnight)
2:00 pm FOMC interest-rate decision, 2:30 pm Fed Chair Powell press conference
FOMC stands pat. https://www.democraticunderground.com/10143634591 ## Fed Chair Powell's top takeaways https://finance.yahoo.com/video/fed-chair-powells-top-takeaways-205343938.html
TUESDAY MARCH 17 (REPORTS)
# Pending home sales February
In January, it was -0.8%. In February, it was +1.8%
Sounds good, thanks to lower mortgage rates. But remember the attack on Iran was February 28, and mortgage rates started rising after that. The mortgage rate was 5.98% on February 12, and it's 6.11% on March 12, the latest.
https://fred.stlouisfed.org/series/MORTGAGE30US
https://www.nar.realtor/newsroom/nar-pending-home-sales-report-shows-1-8-increase-in-february
0.8% decrease year over year
# Home builder confidence index, March
MONDAY MARCH 16 (REPORTS)
# Empire State manufacturing survey March
In February, it was 7.1. In March: -0.2 (+4.1% was expected, per MarketWatch calendar)
# Industrial production, February
In January, it was +0.7%. In February, it was +0.2%
US manufacturing output rises marginally in February, Reuters, 3/16/26
https://www.msn.com/en-us/money/markets/us-manufacturing-output-rises-marginally-in-february/ar-AA1YJDvt
FRIDAY MARCH 13 (REPORTS)
# GDP Q4 - 2nd estimate (there are 3 estimates in total)
The first estimate of 1.4% growth rate has now been revised down in a shocking surprise to just a 0.7% growth rate (these are quarterly growths at an annualized rates). The 2025 whole year growth now stands at 2.2%
LBN THREAD: https://www.democraticunderground.com/10143631718
# PCE Inflation Index, January,
LBN THREAD: https://www.democraticunderground.com/10143631718
Note the above thread is 99% focused on the GDP Q4 = 0.7% story, but it also reports that core PCE inflation reached 3.1% on a 12-month (year-over-year) basis
These graphs definitely show that inflation is not steady, and not coming down:
. . . https://www.democraticunderground.com/?com=view_post&forum=1014&pid=3631734
The CORE PCE is the Federal Reserve's favorite gauge for forecasting FUTURE inflation. This doesn't fit the media's typical narrative that inflation is coming down or at worst "sticky".
Remember the graphs (and OP) on inflation are JANUARY. The FEBRUARY ones are likely to be uglier, given the CPI ones for February that came out 2 days ago --
https://www.democraticunderground.com/?com=view_post&forum=1014&pid=3630564
The Iran thing and the oil and LNG and fertilizer price spikes? The attack on Iran began on Saturday, February 28. So none of this is in the January report or graphs above. And isn't in the February CPI graphs either and won't be in the February PCE when that comes out April 9.
So, the above (January and February) may very likely be remembered as the "good ol' days" of the Trump II kakistocracy.
SOURCE URLS: 3/13/26 release: https://www.bea.gov/data/income-saving/personal-income
. . . CURRENT RELEASE - https://www.bea.gov/news/2026/personal-income-and-outlays-january-2026
. . . FULL RELEASE AND TABLES - https://www.bea.gov/sites/default/files/2026-03/pi0126.pdf
. . . PCE DATA SERIES: https://fred.stlouisfed.org/series/PCEPI
. . . CORE PCE DATA SERIES: https://fred.stlouisfed.org/data/PCEPILFE
# Personal Income and Personal Spending, January,
SOURCE URLS: 3/13/26 release: https://www.bea.gov/data/income-saving/personal-income
. . . CURRENT RELEASE - https://www.bea.gov/news/2026/personal-income-and-outlays-january-2026
. . . FULL RELEASE AND TABLES - https://www.bea.gov/sites/default/files/2026-03/pi0126.pdf
# Durable-goods orders, January,
# JOLTS - Job Openings and Labor Turnover Survey, January,
Job openings inched up in January, data shows
https://finance.yahoo.com/news/job-openings-inched-up-in-january-data-shows-141624127.html
ECONOMY GROUP thread: https://www.democraticunderground.com/1116101837
# Consumer sentiment (prelim), University of Michigan, March,
SOURCE: https://www.sca.isr.umich.edu/
GRAPH 10Y: https://www.sca.isr.umich.edu/files/chicsr.pdf
THURSDAY MARCH 12 (REPORTS)
# Unemployment Insurance Claims, week ending March 7
US weekly jobless claims edge down, Reuters, 3/12/26
https://finance.yahoo.com/news/us-weekly-jobless-claims-edge-124244249.html
Initial claims for state unemployment benefits slipped 1,000 to a seasonally adjusted 213,000 for the week ended March 7,
The number of people receiving unemployment benefits after an initial week of aid, a proxy for hiring, dropped 21,000 to a seasonally adjusted 1.850 million during the week ended February 28,
* SOURCE URL: The CURRENT one is always at: https://www.dol.gov/ui/data.pdf
This report's permalink: https://www.dol.gov/sites/dolgov/files/OPA/newsreleases/ui-claims/20260435.pdf
* Permalinks for the current one and recent previous ones: https://www.dol.gov/newsroom/releases
. . . and search the page for "Unemployment Insurance Weekly Claims Report"
* The source URL has graphs, so one can see the trend over a year
# Trade Deficit, January
US trade deficit dropped by 25% in January, a win for Trump, Yahoo Finance, 3/12/26
https://finance.yahoo.com/news/us-trade-deficit-dropped-by-25-in-january-a-win-for-trump-140526564.html
# Housing Starts, February
# Building Permits, February
WEDNESDAY MARCH 11 (REPORTS)
# CPI Consumer Prices Index, February
LBN Thread: https://www.democraticunderground.com/10143630492
The consumer price index increased a seasonally adjusted 0.3% for the month, putting the 12-month inflation rate at 2.4%,
The 12 month graphs in the OP look nice and tame and even trending down slightly. But they both benefit by hot January 2025 to February 2025 numbers dropping out of the 12-month window: regular CPI: 2.73% annualized, and core CPI: 3.10% annualized. For the trend, what drops out of the 12 month window is every bit as important as what enters the 12-month window
GRAPHS: https://www.democraticunderground.com/?com=view_post&forum=1014&pid=3630564
Percent increases, seasonally adjusted numbers, ANNUALIZED
1 mo 3 mo 12mo
---- ---- ----
3.3% 3.0% 2.4% Regular CPI (includes food & energy)
2.6% 3.0% 2.5% Core CPI (does not have food or energy)
2.0% 2.0% 2.0% Federal Reserve Target
As for the trend,
For the regular CPI, The 3-month average increase (annualized) was at a local low of 2.2% in November but is now at 3.0%
For the core CPI, The 3-month average increase (annualized) was at a local low of 1.6% in November but is now at 3.0%
All of this is before any Iran effects of course (the U.S. - Israeli attack began on February 28).
And in March, the 12-month average is not helped at all by what drops out of the 12-month window: just a very small 0.40% annualized for the regular CPI, and an also very small 0.83% annualized for the core CPI. Not to mention the Iran effects hit full-force in March (if the war keeps on, even more so in April).
News summary https://www.bls.gov/news.release/cpi.nr0.htm
CPI data series: https://data.bls.gov/timeseries/CUSR0000SA0
Core CPI data series: http://data.bls.gov/timeseries/CUSR0000SA0L1E
As a sampler, here is one of the graphs

TUESDAY MARCH 10 (REPORTS)
# ADP Pulse Weekly Report of Private Payroll, last 4 weeks
ADP Pulse: +15,500 jobs/week average for the 4 weeks ending 2/21/26
Multiplying by 52.14/12 to "monthesize it" to the average month: 67,351
. . . (There are 52.14 weeks in a 365-day year, and 12 months)
For comparison, the Bureau of Labor Statistics in their big "First Friday" report found 86,000 net private sector jobs LOST in February
The ultimate source: https://www.adpresearch.com/
and look for "NER Pulse"
# NFIB optimism index Feb.
# Existing home sales Feb.
https://www.msn.com/en-ca/money/finance-real-estate/us-existing-home-sales-unexpectedly-increase-as-mortgage-rates-decline/ar-AA1XVnL9
Home sales rose 1.7% last month to a seasonally adjusted annual rate of 4.09 million units. Data for the prior month was revised up to show sales falling to a rate of 4.02 million units rather than the previously reported 3.91 million-unit pace.
Economists polled by Reuters had forecast home resales decreasing to a rate of 3.89 million units last month.
Overall existing home sales, however, fell 1.4% on a year-over-year basis. The median existing home price last month increased 0.3% from a year ago to $398,000.
The ultimate source: https://www.nar.realtor/research-and-statistics/housing-statistics/existing-home-sales
FRIDAY MARCH 6 (Reports)
# Big "First Friday" BLS jobs report headlining non-farm payrolls and unemployment rate for February, released 3/6/26
Nonfarm payroll jobs FEBRUARY: -92,000, yes, MINUS 92,000 (and with prior 2 months revisions, -69,000, it's 161,000 fewer jobs than was reported in the January report that was released February 11),
(Contrast to the January report, released 2/11/26, where they said there were +130,000 jobs gained in January -- which was revised down a little bit to a still hefty (by recent standards) +126,000 in the February report)
The unemployment rate in the past 3 months: 4.4% to 4.3% to 4.4%
Black unemployment rate: Feb'25: 6.0%, , Jan'26: 7.3%, , Feb'26: 7.7%
The corresponding white unemployment rates are 3.8%, 3.7%, and 3.7%
Private sector nonfarm payroll jobs: -86,000 (Compare to Wednesday's non-government ADP report of +63,000 private sector jobs)
The big downward revision of December resulted in a 2025 job gain total of 116,000, which is an average of only 9,667/month
LBN Thread: democraticunderground.com/10143627754
The one (and only) bright spot: U-6 "underemployment rate" fell from 8.1% to 7.9%. This is essentially the official unemployment rate PLUS they count people who said they have looked for work in the past 12 months (vs. 4 weeks for the official unemployment rate) PLUS they count part-timers who say they want full-time work as underemployed (vs. the official unemployment rate that simply counts them as employed).
Ultimate source of the latest release: https://www.bls.gov/news.release/empsit.nr0.htm
Permanent copy of this February report is at: https://www.bls.gov/news.release/archives/empsit_03062026.htm
Permanent copy of the previous (January) report: https://www.bls.gov/news.release/archives/empsit_02112026.htm
Nonfarm Employment (Establishment Survey): https://data.bls.gov/timeseries/CES0000000001?output_view=net_1mth
Nonfarm PRIVATE Employment (Establishment Survey, https://data.bls.gov/timeseries/CES0500000001?output_view=net_1mth
Unemployment rate http://data.bls.gov/timeseries/LNS14000000
Re: how can barely any jobs have been created in the past 12 months (156k, which averages to just 13k/month), while the unemployment rate has edged up only marginally (from 4.2% in February 2025 to 4.4% in February 2026?) - see 2 URLs just aboveLower Immigration Projections Mean Lower Breakeven Employment Growth Estimates, Federal Reserve Bank of St. Louis, 8/28/25
The old number: 150,000 jobs per month needed to keep the unemployment rate stable
The new number: 57,000 +/- 25,000 at a 90% confidence interval (think Heinz 57 varieties)
FFI: https://www.democraticunderground.com/10143563268#post4
Diane Swonk at KPMG, 3/6/26: at 1:32 in the video: 10,000 +/- 30,000 jobs needed to hold unemployment rate steady
from https://www.msn.com/en-us/money/news/chief-economist-breaks-down-the-latest-jobs-report/vi-AA1XHf22
She doesn't say where that number comes from. It's quite significantly lower than the August 2025 Federal Reserve St. Louis number above.
The Labor Force has increased by only 42,000 in the past 12 months (an average of 3,500 per month). It's down 9,000 from May.
http://data.bls.gov/timeseries/LNS11000000
# Retail sales January delayed report: December: 0.0%, January: -0.2% ( -0.4% expected ), seasonally adjusted
Retail sales sagged in January, Wall St. Journal 3/6/26 (no paywall at this MSN-hosted article)
https://www.msn.com/en-us/money/markets/retail-sales-sagged-in-january/ar-AA1XF2Mp
From the Source: https://www.census.gov/retail/index.html -- > https://www.census.gov/retail/sales.html :
. . . Advance Retail Sales: Retail Trade and Food Services (MARTSMPCSM44X72USN), Not Seasonally Adjusted:
. . . . . . https://fred.stlouisfed.org/series/MARTSMPCSM44X72USN
. . . Advance Retail Sales: Retail Trade and Food Services (MARTSMPCSM44X72USS), Seasonally Adjusted:
. . . . . . https://fred.stlouisfed.org/series/MARTSMPCSM44X72USS
These retail sales figures aren't inflation-adjusted, BTW. So after adjusting for inflation, people bought a lot less stuff
CPI month-over-month: December: +0.3%, January: +0.2% -- https://data.bls.gov/timeseries/CUSR0000SA0
So December was about 0.0 - 0.3 = 0.3% less stuff
and January was about -0.2 - 0.2 = 0.4% less stuff
# CBO's annual report on Social Security
Social Security benefits predicted to run out earlier than expected: Report, Newsweek, 3/6/26
https://www.msn.com/en-us/news/other/social-security-benefits-predicted-to-run-out-earlier-than-expected-report/ar-AA1XGLdH
CBO says the OASI trust fund (OASI = Old-Age and Survivors Insurance) is expected to run out in 2032, a year earlier than previously projected, due to higher inflation and lower payroll tax revenues than projected in last year's report. Once reserves are exhausted, SSA would likely only be able to pay about 80 percent of promised benefits, barring congressional intervention.
The article doesn't say a word about the DI (Disability Insurance) trust fund or OASDI. The Social Security Trustees, in their annual reports, combines the OASI and DI trust funds into a hypothetical OASDI trust fund for purposes of calculating an insolvency date (because they have in the past borrowed from each other and would be expected to do so again). The trustees' 2026 report is expected in April, May, or June (when they put out the report has been erratic for many years).
THURSDAY MARCH 5 (Reports)
# Initial jobless claims week ending Feb. 28
US jobless claims filings unchanged from previous week at 213,000 as layoffs remain low, AP,
https://www.msn.com/en-us/money/markets/us-jobless-claims-filings-unchanged-from-previous-week-at-213-000-as-layoffs-remain-low/ar-AA1XAxBu
* SOURCE URL: The CURRENT one is always at: https://www.dol.gov/ui/data.pdf
This report's permalink: https://www.dol.gov/newsroom/releases/eta/eta20260226
* Permalinks for the current one and recent previous ones: https://www.dol.gov/newsroom/releases
. . . and search the page for "Unemployment Insurance Weekly Claims Report"
* The source URL has graphs, so one can see the trend over a year
# Productivity, Q4, 1st estimate, Commerce Department
These are quarterly numbers at an annualized rate. This follows a big dip in GDP between Q3 (4.4%) and Q4 1st estimate (1.4%).
Q4 nonfarm productivity: +2.8% Q/Q vs. +1.9% consensus and +5.2% prior (revised from +4.9%), according to data released by the Bureau of Labor Statistics on Thursday.
Unit labor costs: +2.8% Q/Q vs. +2.1% consensus and -1.8% prior (revised from -1.9%).
Q4 productivity rises more than expected, labor costs jump past consensus,
https://www.msn.com/en-us/money/markets/q4-productivity-rises-more-than-expected-labor-costs-jump-past-consensus/ar-AA1XACjx
From the source: www.bls.gov/productivity
https://www.bls.gov/news.release/archives/prod2_03052026.htm
reflecting a 5.7-percent increase in hourly compensation and a 2.8-percent increase in productivity ((these are seasonally adjusted annualized rates -progree)). Unit labor costs increased 1.3 percent over the last four quarters. (See tables A1 and 2.)
# Import price index, Feb.
# Challenger, Gray & Christmas on layoffs and hires
https://www.democraticunderground.com/10143626940
Another: https://finance.yahoo.com/news/in-nice-reprieve-job-cut-announcements-declined-last-month-125204515.html
Job cuts announcements declined last month. A complex report.
WEDNESDAY MARCH 4 (Reports)
# ADP employment (private sector workforce) - February (non-govt.) ADP processes payrolls for 20% of the private sector payroll employed, and estimates somehow the other 80%. It's a non-governmental report, so the report's timing is not subject to the government shutdown/startup schedule.
ADP: Private Payrolls: February:: +63,000, (January was revised down from +22,000 to just +11,000)
LBN Thread: https://www.democraticunderground.com/10143626323
Another, Yahoo Finance:
https://finance.yahoo.com/news/adp-private-employers-added-63000-jobs-in-february-the-best-monthly-showing-since-july-132604002.html
Another:- ADP jobs report shows white-collar losses in February. Quartz
ADP jobs report shows white-collar losses in February. Quartz
The ultimate source: https://adpemploymentreport.com/
Monthly, Not Seasonally Adjusted
https://fred.stlouisfed.org/series/ADPMNUSNERNSA
Monthly, Seasonally Adjusted:
https://fred.stlouisfed.org/series/ADPMNUSNERSA
# S&P final U.S. services PMI Feb.
# ISM services Feb.
# Federal Reserve's Beige Book
Fed's Beige Book paints mixed picture of economy as hiring remains flat and tariffs raise costs, Yahoo Finance, 3/4/26
https://finance.yahoo.com/news/feds-beige-book-paints-mixed-picture-of-economy-as-hiring-remains-flat-and-tariffs-raise-costs-202936510.html
US economy got off to a choppy start in 2026, the Fed finds. Here’s the good and bad news., MarketWatch, 3/4/26
https://www.msn.com/en-us/money/markets/us-economy-got-off-to-a-choppy-start-in-2026-the-fed-finds-here-s-the-good-and-bad-news/ar-AA1Xx985
TUESDAY MARCH 3 (Reports)
Nothing. The ADP Pulse report on private payrolls that normally comes out every Tuesday will not come out today becase the monthly national employment report comes out this week (Wednesday).
MONDAY MARCH 2 (Reports)
# S&P final U.S. manufacturing PMI Feb.
# ISM manufacturing Feb
FRIDAY FEB 27 (REPORTS)
# PPI Producer Price Index aka wholesale prices, January -
# PPI January:+0.5% (Nov:+0.2%, Dec:+0.4%), 12 months: +2.8% all seasonally-adjusted
. . .(the 12-month is +2.9% in not-seasonally-adjusted data which for some reason the BLS highlights for 12-month numbers),
# PPI ex food, energy, and trade services - what the BLS considers core PPI although they never use the term "core" ): January: +0.3%, 12 months +3.4%
# PPI ex food and energy: January: +0.8%, 12 months: +3.6%
# LBN THREAD: democraticunderground.com/10143622956
. . . referring to https://www.cnbc.com/2026/02/27/ppi-january-2026-.html
# BLS SOURCE: https://www.bls.gov/news.release/ppi.nr0.htm
# PPI http://data.bls.gov/timeseries/WPSFD4
# PPI ex food, energy, and trade services http://data.bls.gov/timeseries/WPSFD49116
# PPI ex food & energy http://data.bls.gov/timeseries/WPSFD49104
# Note that the BLS never uses the term "core" anywhere in the news release ppi.nr0.htm
# CNBC story (URL above): "Trade services prices surged 2.5%, helping boost pressures on wholesale inflation."
# See also Table A (or TABLE 1?) in ppi.nr0.htm: Trade Services month-over-month percentage increases in the last 6 months were:
. . . -2.1%, +1.6%, -0.9%, -0.5%, +1.8%, +2.5%
# LATER: I think the above line was from Table 1 https://www.bls.gov/news.release/archives/ppi_02272026.htm . But I don't know where I got the -2.1% from END LATER.
# AP story == https://finance.yahoo.com/news/us-wholesale-prices-arrive-hotter-133757417.html
Energy prices were down as gasoline prices dropped 5.5% from December and 15.7% from a year earlier. Wholesale food prices also fell.
# MarketWatch == https://www.msn.com/en-us/money/markets/wholesale-prices-rise-sharply-and-point-to-persistent-inflation/ar-AA1Xd1r3
The Marketwatch story exclusively uses the PPI and the PPI without food, energy, and trade services, and -- following BLS practice -- does not mention at all a PPI without food and energy. They say that the trade margin category "is not a reliable measure of prices"
Below are the annualized numbers so they can be compared to the Fed's 2.0% target:
1 mo 3 mo 12 mo
5.9% 4.7% 2.8% PPI
3.8% 3.4% 3.4% PPI ex Food, Energy, & Trade Services
2.0% 2.0% 2.0% Fed Target
There is a PPI ex food and energy that the media calls "core" (the BLS doesn't use the term "core" anywhere in their news release ppi.nr0.htm, or anywhere else that I know of)
http://data.bls.gov/timeseries/WPSFD49104
1 mo 3 mo 12 mo
10.0% 6.1% 3.6% PPI ex Food & Energy - the BLS does not even show this in ppi.nr0.htm
I use the one that is PPI ex food, energy, and trade services because that is the one the BLS highlights (and did so in the pre-Trump past too, so it's not a conniving Krasnov thing). And for consistency with my previous reports -- Trade services, which is wholesaler's margin, is very volatile from month to month (see above where, from Table A, I display the last 6 months, month-by-month). The idea of core prices is to remove the most volatile components so that it's a better predictor of FUTURE inflation, and that's why the BLS does and did highlight the w/o food, energy, and trade services version. In this month (January) Trade Services is the main engine driving the PPI;s extraordinary monthly growth, and even more so that of the PPI ex food, energy..
The rolling 3 month average of the PPI ex food, energy, and trade services has been trending down from a recent peak of 5.1% in September, to 3.4% in January.(annualized)
But I showed PPI ex Food, Energy above as a line below my usual table because the media is making an enormous hoo hah about it, particularly the 0.8% January over December increase (which annualizes to 10.0%)..
Still, the PPI ex Food, Energy, Trade Services is well above 3% annualized in the 1 month (3.8%), 3 month (3.4%), and 12 month (3.4%) averages..
THURSDAY FEB 26 (REPORTS)
# Unemployment insurance claims
https://www.msn.com/en-us/money/markets/us-filings-for-jobless-aid-rise-modestly-to-212-000-as-layoffs-remain-at-historically-healthy-levels/ar-AA1X8f5z
The number of Americans filing for jobless aid for the week ending Feb. 21 rose by 4,000 to 212,000 from the previous week
. . .The Labor Department’s report Thursday showed that the four-week moving average of jobless claims, which balances some of the week-to-week volatility, ticked up by 750 to 220,250.
The total number of Americans filing for jobless benefits for the previous week ending Feb. 14 fell by 31,000 to 1.83 million, the government said ((this is also widely known as "continuing claims", and what the Dept of Labor calls "insured unemployment" in its report -progree)).
The article also summarizes some recent jobs reports
* SOURCE URL: The CURRENT one is always at: https://www.dol.gov/ui/data.pdf
This report's permalink: https://www.dol.gov/newsroom/releases/eta/eta20260226
* Permalinks for the current one and recent previous ones: https://www.dol.gov/newsroom/releases
. . . and search the page for "Unemployment Insurance Weekly Claims Report"
* The source URL has graphs, so one can see the trend over a year
WEDNESDAY FEB 25 (REPORTS)
# Nvidia's Earnings report - I've never made a Calendar item out of a single stock's report, but while I was doing Tuesday's update, I kept reading comments about how it is a really big deal and a test of AI's financial strength and market sentiment around AI... well here it is:
Nvidia’s blowout earnings report disappoints Wall Street as stock sinks 5%, CNBC, 2/25/26
https://www.cnbc.com/2026/02/26/nvidia-nvda-stock-price-q4-earnings.html
TUESDAY FEB 24 (REPORTS)
# ADP NER Pulse private payrolls weekly estimate - For the four weeks ending February 7, 2026, private employers added an average of 12,750 jobs a week. It was the fourth straight week of strengthening job gains.
SOURCE: https://www.adpresearch.com/ and search for Pulse
https://www.adpresearch.com/what-happened-to-labor-market-dynamism/ search for "NER Pulse" to see the graph
GRAPH:

Multiplying by 52.14/12 to "monthesize it" to the average month: 55,400
. . . (There are 52.14 weeks in a 365-day year, and 12 months)
Compare to latest from BLS: 172,000 PRIVATE SECTOR jobs added in January
. . . https://www.bls.gov/news.release/empsit.t17.htm
Economy Group Thread: https://www.democraticunderground.com/1116101728
# S&P Case-Shiller home price index (20 cities), December
Up 1.4%, same as November, which was also up 1.4%.
# Consumer confidence, February
91.2. 88.6 was expected. Previous time: 89.0.
From the source: https://www.conference-board.org/topics/consumer-confidence/
For graphs, click above link -- the uptick is almost imperceptible. It remains at about the same level as it averaged in the first 9 months of the pandemic
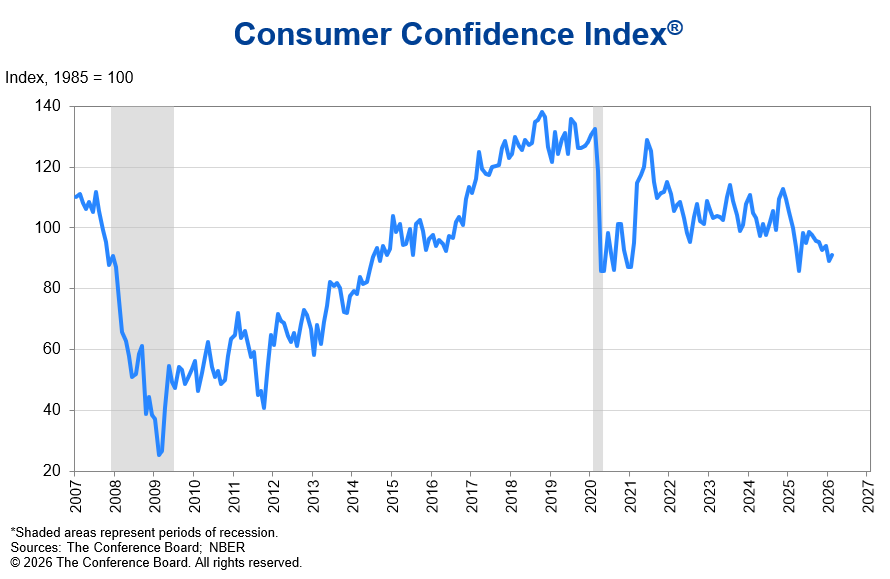
MONDAY FEB 23 (REPORTS)
# Factory orders December
-0.7%. ; +0.2% expected. ; Previous time: +2.7%. Year-over-year: +3.7%
https://finance.yahoo.com/news/us-factory-orders-fall-december-154841615.html
New orders for U.S. factory goods fell in December amid a sharp decline in commercial aircraft bookings, but demand elsewhere was strong, partly driven by robust investment in artificial intelligence.
Factory orders dropped 0.7% after an unrevised 2.7% increase in November, the Commerce Department's Census Bureau said on Monday.
Economists polled by Reuters had forecast factory orders would slip 0.6%. Orders advanced 3.7% on a year-on-year basis in December. The report was delayed by last year's government shutdown,
. . . Manufacturing, which accounts for 10.1% of the economy, has been hamstrung by President Donald Trump's sweeping tariffs, which business leaders say have raised costs for factories and consumers. But some sections have been supported by the rapid adoption of AI.
FRIDAY FEB 20
# GDP Q4 FIRST ESTIMATE
2.5% annualized growth expected, 1.4% is what happened according to the Commerce Department's Bureau of Economic Analysis (BEA)
Q3 was 4.4% annualized rate (I know I know, but the AI spending counts as GDP, even if it produces nothing useful)
Yes, the reported GDP numbers are inflation-adjusted
Full year GDP's: 2024: 2.8%. 2025: 2.2%
LBN Thread: https://www.democraticunderground.com/10143619093
ULTIMATE SOURCE:
. . . https://bea.gov/data/gdp/gross-domestic-product
. . . https://bea.gov/news/current-releases
. . . https://bea.gov/news/2026/gdp-advance-estimate-4th-quarter-and-year-2025
Analysis: These two new economic numbers blew a hole in Trump’s rosy narrative, CNN, 2/21/26
https://www.msn.com/en-us/money/markets/analysis-these-two-new-economic-numbers-blew-a-hole-in-trump-s-rosy-narrative/ar-AA1WNbxe
#1 Trade balance, #2 GDP growth (see Thursday on trade balance)
# PCE Inflation for December - Fed's favorite inflation gauge
Expected: month-over-month: 0.3%, year-over-year: 2.8% (both numbers same as November's)
What happened: month-over-month: regular PCE (includes food and energy) +0.4%
Core PCE (doesn't include food or energy): +0.4%
12 month average (year-over-year): regular PCE: +2.9%, core PCE: +3.0%
LBN thread (this leads off with the GDP, but also includes PCE inflation): https://www.democraticunderground.com/10143619093
GRAPHS: rolling averages of 3 months and 12 months. And month-over-month bar chart. Both regular and core:
. . . https://www.democraticunderground.com/?com=view_post&forum=1014&pid=3619273
This inflation gauge fully includes substitution effects, so for example if beef prices are way up and a lot of consumers switch to turkey necks, this inflation gauge will show a subdued rise or even a drop in the meat price index. But I suspect the Fed likes it because it tends to produce a lower inflation rate than the CPI.
* SOURCE URLS:: https://www.bea.gov/data/income-saving/personal-income
. . . CURRENT RELEASE: https://www.bea.gov/news/2026/personal-income-and-outlays-december-2025
. . . Full Release and Tables: https://www.bea.gov/sites/default/files/2026-02/pi1225.pdf
. . . PCE DATA SERIES: https://fred.stlouisfed.org/series/PCEPI
. . . CORE PCE DATA SERIES: https://fred.stlouisfed.org/data/PCEPILFE
# Personal Income and Spending for December
* SOURCE URLS:: https://www.bea.gov/data/income-saving/personal-income
. . . CURRENT RELEASE: https://www.bea.gov/news/2026/personal-income-and-outlays-december-2025
. . . Full Release and Tables: https://www.bea.gov/sites/default/files/2026-02/pi1225.pdf
# S&P flash U.S. services PMI for February
# S&P flash U.S. manufacturing PMI for February
# New home sales for November and December
# Consumer sentiment (prelim) for February
Consumer sentiment in February shows high prices weigh on US households, but Supreme Court could offer relief, Yahoo Finance, 2/20/26 https://finance.yahoo.com/news/consumer-sentiment-in-february-shows-high-prices-weigh-on-us-households-but-supreme-court-could-offer-relief-161122277.html
The University of Michigan's Index of Consumer Sentiment for February came in at 56.6, up 0.4% from January, but below last year's level of 64.7. The small increase was lower than the 57.2 reading expected by economists. (Be sure to look at the graph that shows the scale of the teeny tiny up-tick still leaving it at incredibly low levels historically.
ULTIMATE SOURCE: https://www.sca.isr.umich.edu/
GRAPH, 10 years: https://www.sca.isr.umich.edu/files/chicsr.pdf
GRAPH, 50 years: https://www.sca.isr.umich.edu/files/chicsh.pdf
THURSDAY FEB 19
# Leading economic index for December Conference Board (non-governmental)
US leading indicators forecast slow start to 2026, Wall St. Journal via MSN (no paywall), 2/17/26
https://www.msn.com/en-us/money/markets/us-leading-indicators-forecast-slow-start-to-2026/ar-AA1WG60g
ULTIMATE SOURCE: https://www.conference-board.org/topics/us-leading-indicators/index.cfm
# Unemployment insurance claims
US weekly jobless claims fall more than expected amid labor market stability (dropped 23k to 206k in week ending Feb 14 ## Continuing claims week ending Feb 7 ROSE 17k to 1.869 M), Reuters, 2/19/26
https://finance.yahoo.com/news/us-weekly-jobless-claims-fall-134542016.html
. . .continuing claims suggested that laid-off workers were experiencing difficulties finding new positions.
The median duration of unemployment is near four-year highs. The lack of hiring has significantly impacted recent college graduates, who because of no or limited work history, cannot file for unemployment benefits and are not captured in the claims data.
* SOURCE URL: The CURRENT one is always at: https://www.dol.gov/ui/data.pdf
This report's permalink: https://www.dol.gov/newsroom/releases/eta/eta20260219
* Permalinks for the current one and recent previous ones: https://www.dol.gov/newsroom/releases
. . . and search the page for "Unemployment Insurance Weekly Claims Report"
# U.S. trade deficit for December (the Commerce Dept)
U.S. trade deficit slipped to $901 billion last year amid Trump tariffs, AP, 2/19/26
https://finance.yahoo.com/news/u-trade-deficit-slipped-901-134134850.html
From $904 billion in 2024 to $901 B in 2025.
The trade gap surged from January-March as U.S. companies tried to import foreign goods ahead of Trump’s taxes, then narrowed most of the rest of the year.
Analysis: These two new economic numbers blew a hole in Trump’s rosy narrative, CNN, 2/21/26
https://www.msn.com/en-us/money/markets/analysis-these-two-new-economic-numbers-blew-a-hole-in-trump-s-rosy-narrative/ar-AA1WNbxe
#1 Trade balance, #2 GDP growth (see Friday on GDP)
# Advanced U.S. trade balance in goods for December
See above AP story
# Mortgages rates
Mortgage rates drop to lowest level in nearly 4 years
https://finance.yahoo.com/personal-finance/mortgages/article/mortgage-rates-drop-to-lowest-level-in-nearly-4-years-110045487.html
WEDNESDAY FEB 18
# Housing Starts for November and December
Housing starts jump to 5-month high in December
Go to Stock Market Today https://finance.yahoo.com/news/live/stock-market-today-dow-sp-500-gain-for-3rd-straight-day-nasdaq-jumps-as-traders-brush-aside-ai-worries-210052721.html
and scroll down the page quite a ways, or search the page for "housing starts"
Yes, I wish Yahoo would give these articles their own URL.
This report followed Tuesday's read on homebuilder confidence from the NAHB, which showed sentiment fell by another point to 36 this month, the lowest reading since September.
**FRED graph shown in the article, graph is titled: "New Privately-Owned Housing Units Started, Total Units" from 2016 onward
# Building Permits for November and December
December was 1.32 million vs. 1.31 million expected and 1.27 million previously, according to https://www.marketwatch.com/economy-politics/calendar
# Durable Goods Orders for December
Durable goods orders were down 1.4% in December vs. down 2.0% expected, and +5.4% previously according to https://www.marketwatch.com/economy-politics/calendar . I believe these are seasonally adjusted. I don't have an explanation, I haven't looked for an article.
# Industrial Production and Capacity Utilization for January
Go to Stock Market Today https://finance.yahoo.com/news/live/stock-market-today-dow-sp-500-gain-for-3rd-straight-day-nasdaq-jumps-as-traders-brush-aside-ai-worries-210052721.html
and scroll down the page quite a ways, or search the page for "industrial production"
Yes, I wish Yahoo would give these articles their own URL.
US industrial production grew in January by widest monthly margin since March 2025 (+0.7%. It was the largest month-on-month percentage increase since March 2025,
# Minutes of Fed's January FOMC meeting
TUESDAY FEB 17
Nothing
MONDAY FEB 16
None scheduled, President's Day holiday
FRIDAY FEB 13
# Consumer price index Jan.
LBN Thread: https://www.democraticunderground.com/10143615668
A lot of response from the Krasnov Krasnov! Brigade. But they were eerily absent when the latest PPI (Producer Price Index, aka Wholesale Prices) report reported a 0.5% increase in December (that's a 6.0% annualized rate), and 3.0% over the past 12 months (their core measure was 3.5% over the past 12 months) https://www.democraticunderground.com/10143608234 (see Reply #1 for more on that 1/30/26 report with the title, "Wholesale prices rise sharply and show new Fed chief could confront stubborn inflation" )
Back to CPI - here's the core part of it, which is considered by the Federal Reserve as more representative of underlying trends and more predictive of FUTURE inflation - assertions that have been back-tested. This one is a rolling 3 month average, so that it's more than a "One off" of the latest month, but with much more recency than year-over-year. It shows a distinctive up-turn

The regular CPI's 3 month rolling average also has risen the last 2 months in a row, although not as sharply. So much for "cooling inflation" I guess.
Chicago Fed's Goolsbee says interest rates could fall 'a fair bit more,' but more inflation progress is needed, Yahoo Finance, 2/13/26
https://finance.yahoo.com/news/chicago-feds-goolsbee-says-interest-rates-could-fall-a-fair-bit-more-but-more-inflation-progress-is-needed-210239035.html
He is concerned about services inflation which tends to be persistent and not driven by tariffs (so an easing of tariffs isn't going to help much with services inflation, and if the impact of tariffs is a one-time thing, as many think, that's not going to help with services inflation. Says inflation has been above the target for more than 4.5 years now)
THURSDAY FEB 12
# Unemployment insurance claims
* SOURCE URL: The CURRENT one is always at: https://www.dol.gov/ui/data.pdf
This report's permalink: https://www.dol.gov/newsroom/releases/eta/eta20260212
* Permalinks for the current one and recent previous ones: https://www.dol.gov/newsroom/releases
. . . and search the page for "Unemployment Insurance Weekly Claims Report"
...
The advance number for seasonally adjusted insured unemployment ((also known as continuing claims -progree)) during the week ending January 31 was 1,862,000, an increase of 21,000 from the previous week's revised level. The previous week's level was revised down by 3,000 from 1,844,000 to 1,841,000.
# Existing home sales Jan.
https://www.cnbc.com/2026/02/12/january-homes-sales.html
. . . The chief economist for the National Association of Realtors, Lawrence Yun, is calling it “a new housing crisis.”
Sales of previously owned homes in January dropped a much wider-than-expected 8.4% from December to a seasonally adjusted, annualized rate of 3.91 million, according to the NAR. Sales were 4.4% lower than January 2025. That is the slowest pace since December 2023 and the biggest monthly drop since February 2022. The median price for a home sold in January was $396,800, up 0.9% year over year and the highest January price on record.
WEDNESDAY FEB 11
# The big "First Friday" monthly BLS jobs report that produces the headline non-farm payroll jobs number and unemployment rate - January
Ultimate source of the latest release: https://www.bls.gov/news.release/empsit.nr0.htm
Permanent copy of this January report: https://www.bls.gov/news.release/archives/empsit_02112026.htm
LBN Thread: https://www.democraticunderground.com/10143614651
The before and after the big jobs revisions, month by month:
https://www.democraticunderground.com/?com=view_post&forum=1014&pid=3615236
Here's a summary table showing the annual totals:
Annual Totals, in thousands
Year Before After Difference
2022] 4555 4526 -29
2023] 2594 2515 -79
2024] 2012 1459 -553
2025] 584 181 -403
2025 comes out to an average of 15k jobs/month. If you remove January, it is 21k/month. A barely above-the-waterline record.
And yet most media headlines are about a big surge in jobs (130,000) in January. 130,000 is not a big number, but relatively speaking it's a "surge" compared to the pathetic average monthly jobs growth in 2025.
The unemployment rate (from a separate survey, the Household Survey) fell from 4.4% to 4.3% (It was 4.0% in January 2025, a year ago)
The Household Survey's "Employed" number increased by just 689,000 since January 2025 ( 57,000 / month average ).
Increase in private sector payroll jobs (for comparison to ADP): +172k
TUESDAY FEB 10
# NFIB optimism index, January
US small-business confidence slipped in January, Wall St. Journal, 2/10/26 (no paywall or gimmicks at this MSN-hosted article)
https://www.msn.com/en-us/money/smallbusiness/us-small-business-confidence-slipped-in-january/ar-AA1W33sy
# US consumer delinquencies jump to highest in almost a decade, Bloomberg, 2/10/26
https://www.msn.com/en-us/money/markets/us-consumer-delinquencies-jump-to-highest-in-almost-a-decade/ar-AA1W4vwC
I haven't had time to read this article, but title is sure gloomy.
# Employment Cost index, Q4 - Considered the best statistic on wages/salaries and benefits, and the Federal Reserve's favorite source on the same.
Economy Group post: https://www.democraticunderground.com/1116101681
From the source: https://www.bls.gov/eci/
Some context:
By fixing workforce composition, the ECI provides a more accurate picture of what is actually happening to wages.
[1] The Pandemic’s Effect on Measured Wage Growth, The WHite House, 4/19/21 ((Biden era))
. . . Original link now gone, thanks to Krasnov: https://www.whitehouse.gov/cea/written-materials/2021/04/19/the-pandemics-effect-on-measured-wage-growth/
. . . The Archive.org link: https://web.archive.org/web/20220208080743/https://www.whitehouse.gov/cea/written-materials/2021/04/19/the-pandemics-effect-on-measured-wage-growth/
# Import price index
This is another one I don't have time to look into now
# Retail sales - caution: not inflation-adjusted, so one gets a distorted view of increases in retail sales, when often most of that is simply due to price increases. It is seasonally adjusted.
RETAIL SALES DECEMBER over November: +0.0%, Inflation was 0.31%, so inflation-adjusted retail sales were down about 0.3% for the month
RETAIL SALES for the 12 month period through December (i.e. year-over-year): +2.4%, Inflation: +2.7%, so inflation-adjusted retail sales were down about 0.3% for the 12-month period
LBN Thread: https://www.democraticunderground.com/10143614155
From the Source: https://www.census.gov/retail/index.html -- > https://www.census.gov/retail/sales.html :
Remember the below numbers are not inflation adjusted
. . . [] Advance Retail Sales: Retail Trade and Food Services (MARTSMPCSM44X72USN), Not Seasonally Adjusted: +10.9% == https://fred.stlouisfed.org/series/MARTSMPCSM44X72USN
. . . [] Advance Retail Sales: Retail Trade and Food Services (MARTSMPCSM44X72USS), Seasonally Adjusted: +-0.0% == https://fred.stlouisfed.org/series/MARTSMPCSM44X72USS
And so the seasonal adjustment process turned a 10.9% increase to 0.0% in December (remember it's the Christmas month ho ho ho)
CPI inflation: https://data.bls.gov/timeseries/CUSR0000SA0
MONDAY FEB 09
Nothing
FRIDAY FEB 06
# Consumer sentiment (preliminary) - February
Consumer sentiment hits highest level since August, but is down 11% from year ago
https://finance.yahoo.com/news/consumer-sentiment-hits-highest-level-since-august-but-down-11-from-year-ago-as-inflation-job-worries-weigh-155341347.html
SOURCE: https://www.sca.isr.umich.edu/
GRAPH, 10 years: https://www.sca.isr.umich.edu/files/chicsr.pdf
GRAPH, 50 years: https://www.sca.isr.umich.edu/files/chicsh.pdf
It's definitely an uptick, but a very small uptick. It's at about the lowest point seen in the post-pandemic 2022 inflation peak, and definitely below the worst levels of the housing bubble and dot-com crashes.
. . .
Friday's reading from the University of Michigan also showed a divergence based on exposure to the stock market, though the report noted responses to this survey were collected prior to the onset of the software-led tech sell-off that started earlier this week.
"Sentiment surged for consumers with the largest stock portfolios, while it stagnated and remained at dismal levels for consumers without stock holdings," Hsu said.
THURSDAY FEB 05
# JOLTS - Job Openings and Labor Turnover Survey - December -
Job openings sink in December to lowest level since 2020
https://finance.yahoo.com/news/job-openings-sink-in-december-to-lowest-level-since-2020-151605057.html
Layoffs and discharges, at 1.8 million, increased slightly from 1.7 million a month earlier.
The hiring rate, meanwhile, improved slightly from a month prior, reaching 3.3%. The quits rate, often seen as a barometer of workers' confidence to jump from their current post to search for greener pastures, also remained at 2%.
# Unemployment insurance claims
US weekly jobless claims rise by more than expected
https://finance.yahoo.com/news/live/stock-market-today-dow-sp-500-nasdaq-sell-off-builds-as-tech-rout-continues-bitcoin-plunges-210019775.html
(and scroll way down)
Continuing claims, a proxy for the total number of people receiving state unemployment benefits, increased to 1.84 million.
More on continuing claims for the week ending January 24 was 1,844,000, an increase of 25,000 from the previous week's revised level. The previous week's level was revised down by 8,000 from 1,827,000 to 1,819,000.
* SOURCE URL: The CURRENT one is always at: https://www.dol.gov/ui/data.pdf . . . this release's permalink is at https://www.dol.gov/newsroom/releases/eta/eta20260205
* Permalinks for the current one and recent previous ones: https://www.dol.gov/newsroom/releases
. . . and search the page for "Unemployment Insurance Weekly Claims Report"
WEDNESDAY FEB 04
# ADP employment (private sector workforce) - January. ADP processes payrolls for 20% of the private sector payroll employed, and estimates somehow the other 80%. It's a non-governmental report, so the report's timing is not subject to the government shutdown/startup schedule.
Private payrolls rose by just 22,000 in January, far short of expectations, ADP says, CNBC, 2/4/26
https://www.democraticunderground.com/10143611175
The total was less than the downwardly revised 37,000 increase in December and below the Dow Jones consensus forecast for 45,000.
The ultimate source: https://adpemploymentreport.com/
Seasonal adjustment turned a 2.171 Million job loss into a 22,000 gain - details: https://www.democraticunderground.com/10143611175#post15
Monthly, Not Seasonally Adjusted
https://fred.stlouisfed.org/series/ADPMNUSNERNSA
Monthly, Seasonally Adjusted:
https://fred.stlouisfed.org/series/ADPMNUSNERSA
TUESDAY FEB 03
# ISM Services - January
MONDAY FEB 02
# ISM manufacturing - January -
FRIDAY JAN 30
# PPI Producer price index (aka wholesale prices) (delayed report) DECEMBER
REGULAR PPI: DECEMBER: +0.5% (Oct: +0.1%, Nov: +0.2%), 12 months: +3.0%
CORE PPI (ex food, energy, trade services): DECEMBER: +0.4%, 12 months: +3.5%
LBN THREAD: https://www.democraticunderground.com/10143608234
BLS SOURCE: https://www.bls.gov/news.release/ppi.nr0.htm
2/3 of the broad-based December rise in prices for final demand services can be traced to a 1.7-percent jump in margins for final demand trade services. (Trade indexes measure changes in margins received by wholesalers and retailers.)
----- Data Series ----
PPI http://data.bls.gov/timeseries/WPSFD4
Core PPI http://data.bls.gov/timeseries/WPSFD49116 (wo food, energy, trade services)
The actual one month numbers (December over November) to 2-digit accuracy: PPI: +0.50%, Core PPI: +0.36%. When annualized, they are 6.0% and 4.4% respectively.
Below are the annualized numbers so they can be compared to the Fed's 2.0% target:
1 mo 3 mo 12 mo
6.0% 3.3% 3.0% PPI
4.4% 5.1% 3.5% CORE PPI = PPI ex Food, Energy, Trade Services
2.0% 2.0% 2.0% Fed Target
There is also a core PPI data series where core is defined as the PPI ex food and energy
http://data.bls.gov/timeseries/WPSFD49104
I use the one that is PPI ex food, energy, and trade services because that is the one the BLS highlights (and did so in the pre-Trump past too, so it's not a conniving Krasnov thing). Trade services, which is the wholesaler's margin, is very volatile from month to month.
THURSDAY JAN 29
# Unemployment insurance claims
Week ending Jan 24 -1,000 to 209,000, 205,000 expected, (Not seasonally adjusted: 231,181)
Continuing Claims, week ending Jan 17: -38k to 1.827M
https://apnews.com/article/unemployment-benefits-jobless-claims-layoffs-labor-21ccf4e6ebbcabbc424e2feb56f0fee7
* SOURCE URL: The CURRENT one is always at: https://www.dol.gov/ui/data.pdf . . . this release's permalink is at https://www.dol.gov/newsroom/releases/eta/eta20260129
* Permalinks for the current one and recent previous ones: https://www.dol.gov/newsroom/releases
. . . and search the page for "Unemployment Insurance Weekly Claims Report"
# U.S. trade deficit (delayed report) NOVEMBER
US trade deficit widens by the most in nearly 34 years in November, Reuters, 1/29/28
https://finance.yahoo.com/news/us-trade-deficit-widens-most-144236696.html
* DU LBN THREAD (also of Reuters article) https://www.democraticunderground.com/10143607655
The trade gap increased 94.6% to $56.8 billion, the Commerce Department's Bureau of Economic Analysis and Census Bureau said on Thursday. The percentage change was the largest since March 1992. Economists polled by Reuters had forecast the trade deficit would rise to $40.5 billion.
MORE ---
The deterioration in the trade deficit in November could temper economists' expectations that trade will deliver another large boost to gross domestic product in the fourth quarter.
Trade contributed to GDP growth in the second and third quarters of 2025.
The Atlanta Federal Reserve is forecasting that GDP increased at a 5.4% annualized rate in the fourth quarter, though estimates from big Wall Street banks, including Goldman Sachs, are running well below a 3.0% pace.
* The U.S. trade deficit isn’t actually falling due to tariffs. It’s still near a record high, MarketWatch 1/29/26
https://www.marketwatch.com/story/fools-gold-the-u-s-trade-deficit-isnt-actually-falling-due-to-tariffs-its-still-near-a-record-high-17412f1b
In November, the deficit almost doubled to $56.8 billion from just $29.2 billion in October.
The October deficit was the lowest since 2009 and was almost entirely the result of disrupted trade patterns tied to higher U.S. tariffs imposed by the Trump administration.
More...
The U.S. trade deficit totaled $839.5 billion through the first 11 months of 2025, compared with $806.5 billion in the same period in 2024.
For all of 20215, the U.S. is on track to post the second- or third-largest trade deficit ever.
# U.S. productivity (revised) Q3 (was 4.9% in the initial report)
# Wholesale inventories (delayed report) NOVEMBER
# Factory orders (delayed report) NOVEMBER
WEDNESDAY JAN 28
# FOMC interest-rate decision and Powell press conference (2:00 P.M. and 2:30 P.M. ET respectively)
As expected, they kept the interest rate unchanged. There were 2 dissents, both wanting a rate reduction. I haven't looked or seen any jibber jabber about how many rate reductions are expected in 2026.
TUESDAY JAN 27
# Consumer confidence, Conference Board, January
Americans' confidence in the U.S. economy falls sharply in January to lowest level since 2014, AP, 1/27/26
https://finance.yahoo.com/news/americans-confidence-u-economy-falls-151544532.html
below even the lowest level of the pandemic
DU LBN Thread: https://www.democraticunderground.com/10143606137
From the source: https://www.conference-board.org/topics/consumer-confidence/
For graphs, click above link, or the DU LBN thread link
MONDAY JAN 26
# Durable-goods orders, NOVEMBER (delayed report)
Durable goods jump more than expected in November, 1/26/26
https://www.msn.com/en-us/money/markets/durable-goods-jump-more-than-expected-in-november/ar-AA1V0fWT
FRIDAY JAN 23
# Consumer sentiment (final) January
Consumer sentiment remains depressed in January as higher costs, weakening labor market weigh on outlook, Yahoo Finance, 1/23/26 https://finance.yahoo.com/news/consumer-sentiment-remains-depressed-in-january-as-higher-costs-weakening-labor-market-weigh-on-outlook-154756985.html
. . . The University of Michigan's Index of Consumer Sentiment for January came in at 56.4, up 3.5 points from December but some 21% below last year's level of 71.7. (the previous preliminary data number was 54)
. . . Inflation expectations showed some signs of improvement, with year-ahead inflation forecasts falling to 4% from 4.2%. (from another article: five to ten year inflation expectations inched up to 3.3% from 3.2% last month.)
. . . Bloomberg - consumer sentiment is at a 5-month high == https://www.msn.com/en-us/money/markets/us-consumer-sentiment-reaches-five-month-high-in-broad-gain/ar-AA1UPxug
. . . Progree - See 10 YEAR CHART - it barely caused the 3-month moving average to turn up just a bit, from a very low level
* SOURCE URL: https://www.sca.isr.umich.edu/
. . . 10 YEAR CHART: https://www.sca.isr.umich.edu/files/chicsr.pdf
# S&P flash U.S. services PMI January
# S&P flash U.S. manufacturing PMI January
Economy shows signs of cooling, S&P finds. Tariffs still weigh on growth and hiring, MarketWatch, 1/23/26
https://www.msn.com/en-us/money/markets/economy-shows-signs-of-cooling-s-p-finds-tariffs-still-weigh-on-growth-and-hiring/ar-AA1UPu58
https://finance.yahoo.com/news/live/stock-market-today-dow-sp-500-cap-volatile-week-with-back-to-back-weekly-losses-210233078.html
A preliminary reading on S&P Global's US Manufacturing PMI showed the activity-tracking index hitting 51.9 in January. That was slightly below the 52 expected by economists tracked by Bloomberg, but a hair above the 51.8 print last month.
Meanwhile, the US Services PMI was 52.5 in January (so far), also short of the 52.9 projected but unchanged from the previous month. A reading above 50 signals growth, while those below reflect contraction.
Similarly, the Composite PMI, which combines the manufacturing and services surveys, hit 52.8 this month. That was higher than December's 52.7 but beneath economists' consensus estimate of 53. ((13 year graph of Composite PMI shown -progree))
The PMI, or Purchasing Managers’ Index, measures the health of the manufacturing or services sector based on surveys of business leaders. Overall, the readings showed business activity was relatively unchanged in January from the previous month.
THURSDAY JAN 22
# PCE inflation FOR NOVEMBER - the Fed's favorite inflation gauge. This is stale, considering that there are numbers out for both the December CPI and the December PPI (producer price index)
* LBN THREAD: Fed's main gauge shows inflation at 2.8% in November, edging further away from target, CNBC, 1/22/26 == https://www.democraticunderground.com/10143603115
* It was a combined October and November report. From a Yahoo article: "For portions of October lacking detailed information from the Consumer Price Index, which is used to calculate PCE, the BEA used an average of September and November figures."
* On a month-over-month basis, both November over October, and October over September came in at 0.2% -- that's true for both the headline number and the core number
* On a year-over-year basis, both the headline and the core numbers were 2.8%
* SOURCE URLS: 1/22/26 release: https://www.bea.gov/data/income-saving/personal-income
. . . CURRENT RELEASE: https://www.bea.gov/news/2026/personal-income-and-outlays-october-and-november-2025
. . . Full Release and Tables: https://www.bea.gov/sites/default/files/2026-01/pi10-1125.pdf
. . . PCE DATA SERIES: https://fred.stlouisfed.org/series/PCEPI
. . . CORE PCE DATA SERIES: https://fred.stlouisfed.org/data/PCEPILFE
# GDP Q3 (first revision) - expected to be 4.3% annualized rate, same as the initial estimate. It turned out to be 4.4% annualized rate
https://finance.yahoo.com/news/consumer-spending-pushes-us-economy-133751928.html
. . . From the PCE article: “The strength of the consumption data adds further weight to the idea that the economy might not need additional policy support, with real consumption rising by 0.3% in both months,” noted Capital Economics economist Thomas Ryan.
# Personal spending and personal income for NOVEMBER -- see:
* SOURCE URLS: 1/22/26 release: https://www.bea.gov/data/income-saving/personal-income
. . . CURRENT RELEASE: https://www.bea.gov/news/2026/personal-income-and-outlays-october-and-november-2025
. . . Full Release and Tables: https://www.bea.gov/sites/default/files/2026-01/pi10-1125.pdf
# Unemployment insurance claims
. . . US applications for jobless benefits inch up last week to a still-low 200,000 (( +1,000 to 200,000, 207k expected, week ending Jan 17 # Continuing Claims, week ending Jan 10: -26k to 1.85M ) AP, 1/22/26 == https://finance.yahoo.com/news/us-applications-jobless-benefits-inch-133912723.html
* SOURCE URL: The CURRENT one is always at: https://www.dol.gov/ui/data.pdf . . . this release's permalink is at https://www.dol.gov/newsroom/releases/eta/eta20260122
* Permalinks for the current one and recent previous ones: https://www.dol.gov/newsroom/releases
. . . and search the page for "Unemployment Insurance Weekly Claims Report"
WEDNESDAY JAN 21
# Pending home sales US pending home sales plunge to five-month low in December, Reuters, 1/21/26
https://www.reuters.com/business/us-pending-home-sales-slump-five-month-low-december-2026-01-21/
Pending home sales index tumbles 9.3%, reverse gains notched since late summer
Spending on new single-family housing projects slumps 1.3% in October
TUESDAY JAN 20 - None scheduled
MONDAY JAN 19 - Martin Luther King Jr. Day, None scheduled
Friday Jan 16
# Industrial production and capacity utilization - US manufacturing output unexpectedly increases in December, Reuters, 1/16/26
https://finance.yahoo.com/news/us-december-industrial-production-rises-142129670.html
Thursday Jan 15
# Unemployment insurance claims
. Initial Unemployment Insurance Claims - Week Ending January 10: 198,000, down 9,000.
. . Note: Not Seasonally Adjusted: 330,684, Seasonally Adjusted: 198,000, quite a big seasonal adjustment
. Continuing Claims (week ending Jan 3): 1,884,000, down 19,000, 1/15/26
https://www.dol.gov/sites/dolgov/files/OPA/newsreleases/ui-claims/20260098.pdf
. Reuters - good article, they say the low seasonally adjusted initial claims level might be due to problem with seasonal adjustment. They also mention the NSA number above (330,684)
. . https://www.reuters.com/world/us/us-weekly-jobless-claims-unexpectedly-fall-amid-seasonal-adjustment-challenges-2026-01-15/
# Import prices
# Empire state and Philadelphia Fed's manufacturing surveys
Wednesday Jan 14
# Retail sales for November (delayed report) (KEEP IN MIND THESE ARE NOT INFLATION-ADJUSTED but they are seasonally adjusted)
Numbers are the increase over the previous month unless specified otherwise e.g. "12 months" which is the 12 month average aka year-over-year
Retail sales rose a better-than-expected 0.6% in November, and rose 3.3% in the past 12 months through November (while inflation thru November was 2.7%, so retail sales gained only 0.6% over the 12 months in inflation-adjusted dollars), AP, 1/14/26 == https://finance.yahoo.com/news/retail-sales-rose-better-expected-134204407.html
(The previous 2 months were pathetic: September was +0.1% (while inflation was +0.3%), October was -0.1% (there are no month-to-month inflation numbers for October or November; again all of these are seasonally adjusted numbers, but not inflation-adjusted),
The MahatmaKaneJeeves LBN Thread: Wholesale inflation was softer than expected, RETAIL SALES moved higher in November, 1/14/26 == https://www.democraticunderground.com/10143598490
. . . [] From the Source: https://www.census.gov/retail/index.html -> https://www.census.gov/retail/sales.html :
. . . [] Advance Retail Sales: Retail Trade and Food Services (MARTSMPCSM44X72USN), Not Seasonally Adjusted: -0.8% == https://fred.stlouisfed.org/series/MARTSMPCSM44X72USN
. . . [] Advance Retail Sales: Retail Trade and Food Services (MARTSMPCSM44X72USS), Seasonally Adjusted: +0.6% (September was +0.1%, October was -0.1%, ) == https://fred.stlouisfed.org/series/MARTSMPCSM44X72USS
. Very strange that in November, the seasonal adjustment process revised the November over October upward from -0.8% to +0.6%. October over September got seaonally revised downward from +4.9% to -0.1%
# PPI (Producer Price Index, aka Wholesale Prices) for November (delayed report)
Numbers are the increase over the previous month unless specified otherwise like "12 months" which is the 12 month average aka year-over-year
PPI for November +0.2% (Oct was +0.1%), 12 months: +3.0%
CORE PPI excluding food, energy and trade services: +0.2% (was +0.7% in October) 12 months: +3.5%, 1/14/26
Note that in November, for both the PPI and Core PPI, the 0.2% increase, when annualized is 2.4%, which exceeds the Fed's 2.0% target. And the year-over-year numbers (PPI: +3.0%, Core PPI: +3.5%) are well over the Fed's 2.0% target
. MahatmaKaneJeeves LBN Thread: Wholesale inflation was softer than expected, retail sales moved higher in November, 1/14/26 == https://www.democraticunderground.com/10143598490
. Ultimate Source: https://www.bls.gov/news.release/ppi.nr0.htm
# Existing home sales (delayed report)
Tuesday Jan 13
# CPI Consumer Price Index - The headline (all items) number was as expected: December (over November): +0.3%, Year-over-year: +2.7%
The Core measure (which excludes food and energy) was a 0.1 percentage points below expectations: December (over November): +0.2%, Year-over-year: 2.6%. Note that the one-month numbers when annualized (3.6% and 2.4%) are over the Fed's 2.0% target, as are both year-over-year numbers.
The actual numbers calculated from the index values for more accuracy:
All items CPI: December (over November): +0.307% (which annualizes to 3.75%),
Core CPI: December (over November): +0.239% (which annualizes to 2.91%),
LBN thread: https://www.democraticunderground.com/10143597741
# New home sales
# Budget deficit
# NFIB optimism index
Monday Jan 12
# Nothing
FRIDAY, JANUARY 9
# Big BLS jobs report : +50,000 non-farm payroll jobs, unemployment rate ticked down from 4.5% to 4.4%. A LOT more to this story, for example, thanks to downward revisions of October and November, there are actually 26k fewer non-farm payroll jobs than were reported in the previous (December 16) report. AND , didya know, in December actual (meaning not-seasonally adjusted) jobs fell by 192,000, but seasonal adjustment turned that to a positive 50,000? Could YOU use a seasonal adjustment like that? AND, President literal asswipe posted several jobs numbers 12 hours before the 8:30 AM ET release time (did you know that they show the president and the entire Council of Economic Advisers the jobs report the evening before it is released?). AND there is probably a couple other things to say, I'll have to review the thread...
the LBN thread link, full of information, is https://www.democraticunderground.com/10143595598
# Consumer Sentiment - a slight improvement but graph still looks awful
https://www.sca.isr.umich.edu/
GRAPH: https://www.sca.isr.umich.edu/files/chicsr.pdf
THURSDAY JANUARY 8
# Unemployment insurance claims: 208,000, an 8,000 increase over last week
# Q3 Productivity - I haven't looked at it, but from a headline I saw, it's a big jump thanks to the 4.3% Q3 GDP (annualized rate) reported in December,
WEDNESDAY, JANUARY 7
# ADP private payroll employment, +41,000 PRIVATE payroll jobs (by the way, in comparison the BLS jobs report that came out Friday 1/9, with the headline +50,000 jobs number, had a private payroll jobs increase of +37,000, a very unusally close match to the ADP number). (ADP has payroll data for about 20% of the private work force, and somehow they estimate the other 80%)
https://www.democraticunderground.com/10143594195
https://adpemploymentreport.com/
# ISM Services,
# JOLTS Job Openings and Labor Turnover Survey, - kinda bad report. lowest job openings in over a year for one thing. The number of job openings fell in November, while the hiring rate was a paltry 3.2%. There were 1.1 unemployed people for every available job, the highest level since early 2021. https://finance.yahoo.com/news/layoff-plans-for-december-hit-lowest-monthly-level-since-2024-in-positive-sign-challenger-says-131808125.html (the article is almost all about the Challenger, Gray, and Christmas report, but the above blurb is in reference to the JOLTS report)
TUESDAY, JANUARY 6
* S&P Services PMI -- shows sector grew at slowest pace in 8 months in December
https://finance.yahoo.com/news/live/stock-market-today-dow-crosses-49000-sp-500-jumps-to-new-high-in-record-setting-start-to-year-194907643.html
(and scroll down that page)
MONDAY, JANUARY 5
* ISM Manufacturing -- US Factory Malaise Continues as Gauge Drops to One-Year Low, Bloomberg 1/5/26
https://finance.yahoo.com/news/us-factory-malaise-continues-gauge-152835595.html
head count shrinks for 11th straight month. (weren't tariffs supposed to fix that?)
FRIDAY, JANUARY 2
* S&P Manufacturing - I haven't seen the report
WEDNESDAY DECEMBER 31
* Weekly unemployment insurance claims, 199,000. It was 214,000 in last week's report
https://www.dol.gov/sites/dolgov/files/OPA/newsreleases/ui-claims/20251646.pdf
TUESDAY DECEMBER 30
* Case-Shiller home prices index - I saw a headline: home prices up for a 3rd straight month, and up 1.4% since October 2024
MONDAY DECEMBER 29
* Pending home sales - I saw a headline: up 3.35% from November and up 2.6% year-over-year (non-govt, National Association of Realtors)
WEDNESDAY DECEMBER 24
* Weekly unemployment insurance claims - 224,000 was reported December 18. 214,000 was reported today, December 24, a drop of 10,000 . But continuing claims rose by 38,000 to 1.92 million (govt)
TUESDAY DECEMBER 23
* GDP Q3 first estimate (delayed report, normally released late September). (govt) -- it came in at a 4.3% annualized rate, well above the 3.3% rate economists were expecting. Various factors cited in media: an acceleration of EV purchases prior to the Sept 30 expiration of tax credits. A lot of spending by big tech companies on AI (investment spending boosts the GDP number). A substantial rise in exports (up 8.8% annualized rate) and a small drop in imports -- both these boost the GDP number, Federal spending also played a sizable role, a reflection of the large uptick in defense spending as well as buyouts for federal workers. Also, it reflects the "K-shaped" economy -- higher-income people flush with growing stock market wealth increased their spending, while lesser-income people struggled with higher prices and a weakening job market.
LBN thread: https://www.democraticunderground.com/10143587157 ## From the source: https://www.bea.gov/news/2025/gross-domestic-product-3rd-quarter-2025-initial-estimate-and-corporate-profits
* Consumer Confidence (Conference Board, non-govt) - result: the 5th straight month of decline. The worst since April, and at about the same level as seen in the 2020 pandemic year. Except there is no microbe-driven pandemic, it's all Trumpdemic now. Consumers’ assessments of their current economic situation tumbled 9.5 points to 116.8.
LBN thread (see graph in reply #2) https://www.democraticunderground.com/10143587258
* Durable goods orders - I haven't looked at yet
* Industrial production and capacity utilization - I haven't looked at yet
FRIDAY DECEMBER 19
* Existing home sales (non-govt) - I haven't looked at yet
* Consumer Sentiment final (non-govt) - here's an article:
https://finance.yahoo.com/news/consumer-sentiment-shows-substantial-decline-from-last-year-amid-higher-prices-tough-job-market-160618145.html
THUR DECEMBER 18:
* Weekly unemployment insurance claims for the week ending Dec 13 (it was 236,000 for the week ending Dec 6) - In the week ending December 13, the advance figure for seasonally adjusted initial claims was 224,000, a decrease of 13,000 from the previous week's revised level. The previous week's level was revised up by 1,000 from 236,000 to 237,000. (govt)
* Consumer price index for November (govt) (note: the one for October was cancelled. The November one was originally scheduled for December 10 before the Fed's rate-setting meeting, but alas was delayed until 8 days after the meeting) - result: 2.7% year-over-year, a cooling from the 3.0% year-over-year reported in the September report, and a 0.2% increase over the last 2 months. LBN thread: https://www.democraticunderground.com/10143584377
TUE DECEMBER 16:
* The long-delayed big Jobs report (featuring the headline non-farm payroll jobs and unemployment rate) (govt). Expected: +50,000 jobs in November and 4.5% unemployment rate. Actual: -105,000 in October and +64,000 in November for a net drop of jobs over these 2 months of 41,000. Nonfarm payroll jobs averaged only 17k/month over the last 7 months and 22k over the last 3 months. These are seasonally adjusted numbers. The raw numbers (i.e. not seasonally adjusted numbers) are 204k/month and 416k/month respectively. And the unemployment rate is 4.6% in November, up from 4.4% in September. LBN thread: https://www.democraticunderground.com/10143583215
There was not, and never will be a separate October jobs report. The payroll stuff Establishment survey was taken and will be included in the November report (as it was in the Decmber 16 report). The household survey that produces the unemployment rate was not done in October, and so the October unemployment rate will be a blank in the records forever.
More details: https://www.democraticunderground.com/10143583215#post19
The LBN thread: https://www.democraticunderground.com/10143583215 .
Please disregard all the comments about "Christmas hires" and "seasonal hires" - those have been adjusted for.
TUE DECEMBER 16 Continued:
There's another jobs report that came out -- the ADP report on PRIVATE sector payrolls:
16,250 private jobs/week for 4 weeks ending 11/29/25 (so roughly +65,000 private sector jobs in the month of November)
LBN thread: https://www.democraticunderground.com/10143583228
Again, ignore the comment about seasonal hiring. The ADP reports seasonally adjusted numbers
Also realize that The ADP numbers cover only about 20% of the nation's private workforce. They have to estimate the other 80%.
https://www.democraticunderground.com/?com=view_post&forum=1014&pid=3506135
The retail sales report that came out December 16: Sept: +0.1% and October: +0.0%. Those are nominal dollar increases. After adjusting for inflation, which was 0.3% month-over-month in September, and an unknown amount in October, those are declines of real spending of 0.2% and 0.3%, assuming that October also comes in at 0.3% month-over-month inflation. Yes, they are seasonally adjusted.
https://www.msn.com/en-us/money/markets/retail-sales-flat-in-october-as-uncertainty-tempers-consumer-spending/ar-AA1SsP9b
S&P flash U.S. services and manufacturing PMI's (non-govt) - I haven't looked at this yet
=================================================================
General Comments
Please don't believe the fabrication that Fed Chair Powell said, or implied, that the jobs numbers are "fudged". He did not. The person posting that claim included no excerpt that one can read to judge what exactly he said, and that was deliberate. When confronted, that person expressed some other reasons (again without supporting information) for believing the numbers are fudged. That may be so, But that does not excuse very deliberately misleading one's fellow progressives about what Powell said.
Please don't believe reports that 1 million or 1.1 million jobs were lost in 2025 so far, implying these are net job losses (jobs lost minus jobs gained). This is based on Challenger, Gray, and Christmas that reported 1,170,821 job cuts were ANNOUNCED. And they are just layoff announcements, and they are not net of hiring announcements or any actual hiring. As the monthly JOLTS (Job Openings and Labor Turnover Survey) shows, there are a lot of layoffs (and voluntary leavings of jobs) and a lot of hiring every month. The excuse that media misreports the Challenger report too is not an excuse for deliberately misleading one's fellow progressives, after being presented with the information about what the Challenger etc. report actually said.
The media mis-reports a lot of things like Hillary's email and Hunter Biden's laptop with cherry-picked misleading factoids, but that is never an excuse for echoing those reports here after being made aware of the factual record.
There's another myth that's spreading: that the new head of the BLS (Bureau of Labor Statistics) is a Trump appointee, E.J. Antoni. However, his nomination was withdrawn due to too many controversies.
The current head is Acting Commissioner, William J. Wiatrowski, who has served in this role twice previously, the first time from January 2017 to March 2019, and the second time from March 2023 to January 2024
https://en.wikipedia.org/wiki/Bureau_of_Labor_Statistics
Global Stocks Trounce the S&P 500 in Trump’s Chaotic First Year, Bloomberg, 1/20/26
https://finance.yahoo.com/news/global-stocks-trounce-p-500-131530108.html
URL above no longer works, this one does but only for a page or so of the article, then it hits "Story Continued" button that does nothing when clicked: https://web.archive.org/web/20260120223645/https://finance.yahoo.com/news/global-stocks-trounce-p-500-131530108.html
Trump’s comparison with his predecessors is no better: As far as the S&P 500 goes, the first-year gain under Trump clocks in as only the ninth best start to a term since World War II, according to CFRA. Ronald Reagan, George H.W. Bush, Bill Clinton, Barack Obama, Joe Biden — and even Trump during his first stint — all saw bigger gains.
US presidents, of course, don’t determine the direction of the stock market, as much as they take the blame or credit. But in Trump’s case, his trade war, foreign-policy surprises like pushing for a US takeover of Greenland, moves to exert greater control over key industries, and threat to the Federal Reserve’s independence have all periodically unnerved investors. That, in turn, has effectively tapped the brakes on a rally driven largely by the artificial-intelligence boom and the surprisingly resilient economy he inherited.
-snip-
[Also] MSCI’s emerging-market index rose over 30% last year, it’s biggest advance since 2017.
The S&P 500 gained 15.7% in Trump's first year, according to a table in the article, comparing the first year of all presidential terms since (and including) FDR.
US stocks are off to their worst start versus the global market since 1995, Yahoo Finance, 2/18/26
https://finance.yahoo.com/news/us-stocks-are-off-to-their-worst-start-versus-the-global-market-since-1995-110019152.html
*THERE's an iShares MSCI ACWI ex U.S. ETF (ACWX) VERSUS S&P 500 - where one can set 1 D, 5D, 1M, 6M, YTD (9.7% v. 0.8%), 1Y (31.7% vs. 12.9%), 5Y (30.0% v. 76.7%), ALL (starting about 4/2008: 35% vs. 393%)
(ACWI stands for All Country World Index). One can see that the S&P 500 vastly outperformed the rest of the world in the past 5 years and the past 18 years, but since late 2024, the rest of the world has outperformed the S&P 500.
And in an environment where geopolitical risk increasingly comes from inside the US — whether from the Trump administration's tariff regime, comments about an annexation of Greenland, or other moves — investor attention has turned toward the rest of the world.
...US stocks just keep getting more expensive. ... through the last 10 years, as Big Tech's explosion has driven valuations sky high, US price-to-earnings ratios are now an average of 40% higher than those throughout the rest of the world market.
The US stock market has also become heavily concentrated in the tech sector.
As of December, the top 10 largest companies in the US — the "Magnificent Seven" Big Tech stocks, plus Broadcom (AVGO), Eli Lilly (LLY), and Visa (V) — accounted for 40% of S&P 500 holdings, according to data from the investment brokerage Lord Abbett, far above the roughly 20% weight of the top 10 holdings a decade ago.
"The US market trades above a 20x P/E — even excluding the 'Magnificent 7,'" Goldman Sachs strategists wrote in a recent client note. "This is unusually high."
progree
(13,131 posts)See OP for the statistics.
progree
(13,131 posts)See OP for details
progree
(13,131 posts)see OP for details.
progree
(13,131 posts)Details in OP.
progree
(13,131 posts)See OP for details, and a graph of the DOW.
progree
(13,131 posts)Details in the OP.
progree
(13,131 posts)Details in the OP.
progree
(13,131 posts)Details in OP.
progree
(13,131 posts)Details in OP.
progree
(13,131 posts)Details in OP. ATH is All Time High. I don't kick this every market day, but it's been several days, and it's gotten well down on the listings, so I decided to kick it. It looks like the Trump slump since election day is about at an end, only 0.1% down since election day, and with 3 straight market days of gains. Since inauguration day, its down 3.7%.
progree
(13,131 posts)ATH is All Time High. Details in OP including more comparisons like down 5.4% since pre-inauguration day, and down 3.6% year-to-date.
I don't kick this every market day, but it's been several days, and it's gotten well down on the listings, so I decided to kick it. Note this closing is moments before the announcement of "Liberation Day" tariffs, so it's a good benchmark to compare to what follows in the next few days.

Arizona78
(8 posts)Trump’s bill could soon trigger a repo market crisis and push America and much of the world—toward bankruptcy. Something massive is on the horizon. Get ready.
Paul Krugman is deeply concerned about the uncontrolled rise in debt, which could sharply push up interest rates leading to bankruptcy.
https://paulkrugman.substack.com/p/trumps-big-beautiful-debt-bomb

Hugin
(38,158 posts)I look at it often. 
progree
(13,131 posts)Hugin
(38,158 posts)Crypto has taken over the last week or so. BTC $120K to ~ $97K.
progree
(13,131 posts)I'm seeing that proclaimed in a couple of articles in the yahoo.finance.com page today.
It's all-time high in October was over $126,000. Right now as I post this, it's 96,277, down 23.6%
I've been reporting Bitcoin near the top of my OP each time I update anything, along with the 10-year Treasury yield. I'm not sure why, but a lot of people are interested in it. Actually, it's kind of against my "religion", given the amount of electricity and water that bitcoin "miners" consume. I read recently that just ONE Bitcoin transaction uses as much electricity as does the average U.S. household over 38 days (more than a month!)
I might buy the Bitcoin evangelists' argument that bitcoin's high value (still) is that they keep the bitcoin supply very limited. But there are all kinds of new cryptocurrencies being created and eventually the amount of money available from people willing to support this ever-expanding ocean of speculative crypto-investments will reach a peak. (And besides, rarity doesn't guarantee high value).
Hugin
(38,158 posts)If I had a nickel for every time I’d said that. 
I am far from liking anything about crypto. I try to avoid things that are easy to buy and difficult to sell. I do monitor it, tho. Due to its position in the techbro’s DOW -> AI -> Crypto financial ouroboros.
progree
(13,131 posts)With this Friday's update (actually posted Sunday 2/15), I've added to the calendar of reports (the "calendar" is a list of past economic reports with most results summarized as well as scheduled future ones)
# NFIB optimism index - small business confidence slipped
# US consumer delinquencies jump to highest in almost a decade
# Employment Cost index, Q4 - Considered the best statistic on wages/salaries and benefits
# Import price index
# Retail sales (seasonally adjusted) in December did not keep up with inflation, meaning consumers bought less stuff when adjusted for prices
# The big "First Friday" BLS jobs report that was ballyhoo'd as a big surge of jobs in January (a historically pale +130k, but since it was better than the horrible months before, the media decided it was a "surge" ). And 2024 and 2025 were revised down by a combined nearly million jobs in their annual revision, leaving only 181,000 net new jobs in all of 2025 which averages to only 15k/month.
# Unemployment insurance claims - fell by 5,000, but continuing claims up by 21,000
# Existing home prices -- Realtors report a ‘new housing crisis’ as January home sales tank more than 8%
# CPI Consumer price index - the media ballyhoo'd it as a softening of inflation, but the 3-month rolling average rose for the 2nd month in a row. The Chicago Federal Reserve's Goolsbee points out that worrisomely service inflation is persistent and little affected by what happens with tariffs either way (IOW if tariffs are softened and/or the impact of tariffs was a "one off" one-time event, inflation will still be a problem), and that inflation has been above the Fed's target for more than 4 1/2 years now..
(The summaries in the "Calendar" section of the OP are for the most part longer, than what I've shown above, and with links).
I've also added the coming week's reports, many with links to the source data
As usual, I provide a summary of each day's stock market / economic activity, including the "Scrolling down the page" (Yahoo Finance's "Stock Market Today" page) for articles of interest.
All this takes me at least 7 hours a week. This is bordering on unsustainable, but I find the "Calendar" collection of reports and source links and LBN and other DU threads' links a very useful reference.
Some of these are non-government reports, so they can be somewhat broadly compared to the picture that the federal reports are painting. E.g. the ADP private payrolls report (ADP is a private processor about 20% of the U.S. private payroll, and they estimate the other 80%), and the Challenger, Gray and Christmas reports. The consumer confidence and consumer sentiment reports (separate reports from separate non-government organizations) are also of interest, as are existing housing sales.