Welcome to DU!
The truly grassroots left-of-center political community where regular people, not algorithms, drive the discussions and set the standards.
Join the community:
Create a free account
Support DU (and get rid of ads!):
Become a Star Member
Latest Breaking News
Editorials & Other Articles
General Discussion
The DU Lounge
All Forums
Issue Forums
Culture Forums
Alliance Forums
Region Forums
Support Forums
Help & Search
SP500 closed Tue. 5/26 at 7519 up 0.6% to a new ATH. # Consumer Confidence dipped, ADP Pulse came out Wednesday [View all]
This discussion thread is pinned.
Last edited Wed May 27, 2026, 11:23 AM - Edit history (281)
5/26 status notes: I decided to drop some little thing for Tuesday 5/26 because it's been such a long time. Things are not going well health-wise and otherwise, so dunno what to tell you about updates anymore that is even slightly credible. I still haven't given up.Behind the scenes I've been working on putting together a collection of the most informative reports, so for example, the best "First Friday" (Employment Situation) job report, the best ADP private payroll jobs report, the best CPI inflation report etc.. -- "best" means the one with the most generic links and explanatory material (not specific to any given week or month). They will be collected in a reply below yet-to-be-determined.
Anyway, so that people, and I, have easy access to the generically most informative ones (these reports won't have a particular week's or month's data, it's for finding out, for example, that the ADP private payrolls report is produced by a private payroll processing firm (so it's not a government report), that it is seasonally adjusted, that it is the PRIVATE sector (as opposed to the headline Bureau of Labor Statistics "First Friday" report which includes government jobs, and about what percent of all payroll jobs is private jobs and what percent are government jobs), that the report is at whatever link (how to find the latest at any time), that graphs are at whatever link, and so on. This will make it easier for me to write decent reports easily.
TUESDAY 5/26/26
S&P 500: +0.61%, , DOW: -0.23% ( -118 points, ), , NASDAQ: +1.19%, ,
10Yr Treasury yield: 4.49% -0.06 (Last Tuesday's 4.67% was a 52-week high), ,
Bitcoin: $75,898 @ 834p ET, , , WTI OIL: $93.11 -0.83%
Stock market today: S&P 500, Nasdaq jump to records as Micron tops $1 trillion market cap, Yahoo Finance, Tuesday 5/26/26
https://finance.yahoo.com/markets/live/stock-market-today-sp-500-nasdaq-jump-to-records-as-micron-tops-1-trillion-market-cap-112100210.html
(I'm skipping my customary excerpts, because, for now, all I have time for is a "I'm still alive" something-or-other)
Be sure to scroll down that page for many other informative articles for today
The S&P 500 closed Tuesday May 26 at 7519, up 0.6% for the day,
and up 30.0% from the 5783 election day closing level,
and up 25.4% from the inauguration eve closing level,
and up 27.8% since the December 31, 2024 close
and up 9.8% Year-To-Date (since the December 31, 2025 close)
The Dow closed Friday May 22 at 50,580, and it closed Tuesday at 50,462, a drop of 0.2% (118 points) for the day
Consumer Confidence, May
LBN THREAD (excellent, multiple graphs): https://www.democraticunderground.com/10143670628
U.S. Consumer Sentiment Worsened In May, Wall St Journal via MSN (no paywall, no gimmicks) - but one problem: It's mistitled (WSJ's mistake) it's the Consumer CONFIDENCE report, put out by the Conference Board, not to be confused with the Consumer SENTIMENT report, put out by the University of Michigan that came last Friday, May 22 https://www.democraticunderground.com/10143668631 , which showed that index to be at an all-time low, going back to 1961. The graph is a must-see ( https://www.democraticunderground.com/10143668631#post3 )
ADP weekly pulse of private payroll jobs - this usually comes out every Tuesday with an exception for the week that the monthly ADP report comes out (usually 2 days before the BLS's "First Friday" Employment Situation report). I was expecting one today, it's usually at https://www.adpresearch.com/ , but as of Tuesday, 5/26/26 9:24 P.M. EDT, it's still showing an old report that came out a week ago: +42,250 PRIVATE sector jobs in the week ending May 2. (Monthesizing, that's an 183,600 jobs/month rate).
LATER: WEDNESDAY 5/27 11:13 AM ET - it came out Wednesday (apparently Memorial Day Monday altered their schedule). The week ending May 2 was revised down to +40,750 PRIVATE SECTOR jobs a week, and today's report reported that the week ending May 9 is 35,750 PRIVATE SECTOR jobs a week, which monthesizes to a rate of 155,340/month. I like this graph: https://tradingeconomics.com/united-states/adp-employment-change-weekly
S&P Case-Shiller home price index (20 cities), March Actual: +0.7%, Previous: +0.8%
The above comes from the MarketWatch Calendar, https://www.marketwatch.com/economy-politics/calendar , and I don't know if this is a monthly change or a year-over-year change. From comparison with the link below,
Here's a link to what is the originator
https://www.spglobal.com/spdji/en/index-family/indicators/sp-cotality-case-shiller/sp-cotality-case-shiller-composite/#overview
https://www.spglobal.com/spdji/en/index-family/indicators/sp-cotality-case-shiller/sp-cotality-case-shiller-composite/#indices
It says the 20 cities index is up 1.04% over the past month, and 0.83% over the past year (12 months). The 0.83% doesn't quite agree with the Marketwatch Calendar 0.7% number, so life sucks and then you die. That's why writing these damn reports is not just a matter of scraping and pasting some media narrative.
The rest of below is the same as what was here May 18
The rest of below is the same as what was here May 18
5/18 status notes:
I've gotten so far behind and the week of 5/18-5/22 is very busy for me with necessary things needing taken care of.
Normally, when I'm not behind, updates take AT LEAST 7 hours a week, and involves finding some information on all the economic reports listed in the MarketWatch calendar ( https://www.marketwatch.com/economy-politics/calendar ) , and detailed look (far far beyond scraping and pasting media garbage) for the more important reports like the inflation reports, the big jobs "First Friday" report and ADP Payroll reports, Consumer Confidence and Consumer Sentiment (two different reports from two different organizations) and a few others. I just haven't had the time, and am not sure what to do going forward. I will be prioritizing the reports going forward.
Remember that the graphs at the bottom of the OP (Dow, Dollar, Oil) still automatically self-update, sometimes with a few hours delay, sometimes a couple days. (I've considering moving closer to the top or making a click away, since its about the only thing that's being kept up to date)
Oh, I did promise the May 13 PPI (Producer Price Index, aka Wholesale prices) which was a disaster (see this links for the graphs and table) --
https://www.democraticunderground.com/?com=view_post&forum=1014&pid=3664372
Percent increases over the past month, over the past 3 months, and over the past 12 months, seasonally adjusted numbers, ANNUALIZED
1 mo `3 mo `12mo
----- ----- -----
17.8% 11.1% 6.0% Regular PPI (includes food & energy)
`7.0% `5.3% 4.4% Core PPI (does not have food nor energy nor trade services)
2.0% 2.0% 2.0% Federal Reserve Target
backquote symbols (`) added for spacing. Please try to ignore them
LBN thread on the PPI report: https://www.democraticunderground.com/10143664341
5/5/26 and 5/11 and 5/12 status notes:
A lot of things just happened in the past week and had to take priority. Just so people don't wonder if I passed, or given up on this thread.
Most people know already that S&P 500 and NASDAQ are closing at new highs.
I added something on Tuesday's hot CPI inflation report in the calendar below.
I intend to put something here about Wednesday's PPI (producer price index aka wholesale inflation) report Wednesday. A full update with all the junk below cleaned up won't happens until Saturday 5/16.
I added "The Table" of S&P 500 vs. various benchmarks just below, as well as the to Yahoo Finance's May 11 and May 12 reports
Remember that the graphs at the bottom of the OP (Dow, Dollar, Oil) still automatically self-update, sometimes with a few hours delay, sometimes a couple days.
====== END STATUS NOTE 5/5/26 and 5/11 and 5/12 ==========
MONDAY 5/11/26
Stock market today: Dow rises, S&P 500 and Nasdaq eke out records as chip stocks extend gains, Yahoo Finance, Monday 5/11/26
https://finance.yahoo.com/markets/stocks/live/stock-market-today-monday-may-11-oil-rise-trump-rejects-peace-225625559.html
S&P 500: +0.19%, , DOW: +0.19% (+95 points), , NASDAQ: +0.10%, ,
10Yr Treasury yield: 4.41% +0.05 , , Bitcoin: $81,543 @928p ET, , , WTI OIL: $98.32 +0.26%
TUESDAY 5/12/26
Stock market today: Dow rises, S&P 500 and Nasdaq retreat on hot inflation print, tech sell-off, Yahoo Finance, 5/12/26
https://finance.yahoo.com/economy/live/stock-market-today-dow-rises-sp-500-and-nasdaq-retreat-on-hot-inflation-print-tech-sell-off-224350548.html
S&P 500: -0.16%, , DOW: +0.11% (+56 points), , NASDAQ: -0.71%, ,
10Yr Treasury yield: 4.46% +0.05 , , Bitcoin: $80,634 @727p ET, , , WTI OIL: $102.00 -0.18%
The S&P 500 closed Tuesday May 12 at 7401, down 0.2% for the day,
and up 28.0% from the 5783 election day closing level,
and up 23.4% from the inauguration eve closing level,
and up 25.8% since the December 31, 2024 close
and up 8.1% Year-To-Date (since the December 31, 2025 close)
The Dow closed Monday at 49,704, and it closed Tuesday at 49,761, a rise of 0.1% (56 points) for the day
The CPI inflation report and ADP weekly pulse report is in the Calendar below
MAY 4-8 WEEK'S CALENDAR (May 4 - May 8)
@@@@@@@@@@@@@@@@@@@@@@@@@@@@@@@@@@@@@@@@@@@@@@@@@@@@@@@@@@@
Time (ET) Report Period Actual Median Forecast Previous
MONDAY, May 4
10:00 am Factory orders March, Actual: 1.5%, Previous: 0.3%
TUESDAY, May 5
8:30 am U.S. trade balance March Actual: $60.3 Billion, Expected: -60.9 Billion, Previous: -$57.8 Billion -- yes, tat's what it says
9:45 am S&P final U.S. services PMI April Actual: 51.0, Expected: , Previous: 51.3
10:00 am Job openings March Actual: 6.87M , Expected: 6.80M , Previous: 6.92M
10:00 am New home sales* (delayed report) Feb. Actual: 635,000, Expected: 631,000, Previous: 583,000
10:00 am New home sales March Actual: 682,000, Expected: 660,000, Previous: 635,000
10:00 am ISM services April Actual: 53.6% , Expected: 54.3%, Previous: 54.0% (are these supposed to be in %'s ??)
WEDNESDAY, MAY 6
8:15 am ADP employment April, Actual: 109,000, Expected: 84,000, Previous: 61,000 (these are ADP's estimate of PRIVATE SECTOR net jobs increases)
THURSDAY, MAY 7
8:30 am Initial jobless claims week ending May 2 Actual: 200,000, Expected: 206,000, Previous: 190,000
8:30 am U.S. productivity Q1 Actual: 0.8% , Expected: 1.1% , Previous: 1.6%, These are quarterly numbers at an anuualized rate
10:00 am Construction spending* (delayed report) Feb. Actual: -0.2%, Expected: 0.1%, Previous: -1.9%
10:00 am Construction spending March Actual: 0.6% , Expected: 0.3%, Previous: -0.2%
3:00 pm Consumer credit March Actual: --- , Expected: $12.5 billion, Previous: $9.5 billion
FRIDAY, MAY 8
8:30 am U.S. employment report, headline non-farm payroll increases April Actual: 115,000 , Expected: 55,000, Previous: 185,000 , NOTE on the 115,000 -- yes, but the 2 previous months were revised downward by a combined 16,000, so the actual job gain was 99,000 compared to what was reported a month previously. Also (see https://finance.yahoo.com/economy/articles/us-employment-boom-maybe-maybe-185245547.html (in list above)) the number of employed people in the separate Household Survey has been greatly lagging the above-cited non-farm payroll jobs from the Establishment Survey
8:30 am U.S. unemployment rate April: Actual: 4.3%, Expected: 4.3%, Previous: 4.3%
8:30 am U.S. hourly wages April: Actual: +0.2% , Expected: +0.3%, Previous: +0.2% (these aren't adjusted for inflation)
8:30 am Hourly wages year over year, Actual: +3.6%, Expected: +3.8% , Previous: +3.4% (these aren't adjusted for inflation)
10:00 am Wholesale inventories March , Actual: 1.3%, Expected: 1.4%, Previous: 0.9%
10:00 am Consumer sentiment (prelim) May: Actual: 48.2 , Expected: 49.7 , Previous: 49.8
This is a new fresh all-time-low: https://finance.yahoo.com/economy/article/consumer-sentiment-hits-fresh-low-as-higher-gas-prices-drag-on-americans-outlooks-155315647.html
MAY 11-15 WEEK'S CALENDAR (May 11 - May 15)
@@@@@@@@@@@@@@@@@@@@@@@@@@@@@@@@@@@@@@@@@@@@@@@@@@@@@@@@@@@
Scraped Monday 5/11 752a, then Monday and Tuesday numbers updated for actuals
Time (ET) Report Period Actual Median Forecast Previous
MONDAY, May 11
Existing home sales April : Actual: 4.02 million , Expected: 4.1 M, Previous: 4.0M
Home sales edge up == https://finance.yahoo.com/economy/articles/us-existing-home-sales-increase-140150246.html
Home sales underwhelmed == https://finance.yahoo.com/sectors/real-estate/article/home-sales-underwhelmed-in-april-amid-elevated-mortgage-rates-and-economic-jitters-144632986.html
TUESDAY, May 12
NFIB optimism index April : Actual: 95.9, Expected: 96.2, Previous: 95.8
Consumer price index April
8:30 am Consumer price index (month-over-month) April: Actual: 0.6% , Expected: 0.6% , Previous: 0.9%
8:30 am CPI year over year: Actual: 3.8%, Expected: 3.8%, Previous: 3.3%
8:30 am Core CPI (month over month) April : Actual: 0.4%, Expected: 0.4%, Previous: 0.2%
8:30 am Core CPI year over year: Actual: 2.8%, Expected: 2.7%, Previous: 2.6%
LBN THREAD: https://www.democraticunderground.com/10143663939
GRAPHS and Table: https://www.democraticunderground.com/10143663939#post9
Percent increases over the past month, over the past 3 months, and over the past 12 months, seasonally adjusted numbers, ANNUALIZED
1 mo 3 mo 12mo
---- ---- ----
8.0% 7.3% 3.8% Regular CPI (includes food & energy)
4.6% 3.2% 2.8% Core CPI (does not have food or energy)
2.0% 2.0% 2.0% Federal Reserve Target
BLS news summary https://www.bls.gov/news.release/cpi.nr0.htm
Time? ADP weekly Pulse of PRIVATE SECTOR non-farm payrolls by ADP payroll processors: Actual: 33,000 week ending April 21 (I think that's the latest. This "monthesizes" to 143,000, Expected: , Previous:
https://www.adpresearch.com/
Monthly U.S. federal budget April : Actual: $215 billion, Expected: $217 billion , Previous: -$164 billion
WEDNESDAY, MAY 13
8:30 am Producer price index April : Actual: ___, Expected: 0.6% , Previous: 0.5%
8:30 am Core PPI April : Actual: ___, Expected: 0.3%, Previous: 0.2%
8:30 am PPI year over year: Actual: ___ , Expected: , Previous: 4.0%
8:30 am Core PPI year over year: Actual: ___, Expected: , Previous: 3.6%
THURSDAY, MAY 14
8:30 am U.S. retail sales April: Actual: ___, Expected: 0.5%, Previous: 1.7% (REMEMBER THESE ARE NOT ADJUSTED FOR INFLATION)
8:30 am Retail sales minus autos April: Actual: ___, Expected: 0.6%, Previous: 1.9%
8:30 am Initial jobless claims week ending May 9: Actual: ___, Expected: 205,000, Previous: 200,000
8:30 am Import price index April: Actual: ___ , Expected: 1.0%, Previous: 0.8%
8:30 am Import price index minus fuel April : Actual: ___ , Expected: , Previous: 0.6%
10:00 am Business inventories March : Actual: ___, Expected: 0.9%, Previous: 0.4%
FRIDAY, MAY 15
8:30 am Empire State manufacturing survey May: Actual: ___, Expected: 6.5, Previous: 11.0
9:15 am Industrial production April: Actual: ___ , Expected: +0.2% , Previous: -0.5%
9:15 am Capacity utilization April: Actual: ___, Expected: 75.8%, Previous: 75.7%
The full calendar: https://www.marketwatch.com/economy-politics/calendar
What's below is what's been there since 4/28.
The title line always has the closing price of the S&P 500, and the change since the previous close. I shortened it a bit to leave more room in the title line for mentions of key reports
I will be doing these only twice a week again: Tuesday and Friday (hah hah, promises promises. I still haven't given up on this goal).
10Y Treasury, in chronological order: It local-bottomed out at 3.95% Oct 22, 2025, its lowest point since April 2025. . 4.19% on Dec 2, 2025, , 4.27% on Feb 3, 2026, , 3.96% on Feb 27 (just before Iran War), , 4.12% on March 5, , 4.44% on Friday March 27, 4.31% on April 24
https://www.cnbc.com/quotes/US10Y (best) -or- https://finance.yahoo.com/quote/%5ETNX/
10 Year Treasury price: https://finance.yahoo.com/quote/ZN%3DF/
Bitcoin, In chronological order: It was $95,401 Jan 16, , $84,009 on Jan 30, , $75,512 on Feb 3, , $65,564 on Feb 27, , $71,357 on March 13 , , $74,580 March 17 $65,795 @ 440p ET, $77,592 @ 1129p ET April 24 ##### It's in bear market territory, down more than 20% from it's $126,000+ all-time high in October (20% down from $126,000 is $100,800) ACTUALLY, it's down 38% from $126,000 (Cryptocurrencies trade 24/7)
https://finance.yahoo.com/quote/BTC-USD/
Next Fed rate decision: THIS WEDNESDAY April 29 (last was March 18)
CME FedWatch tool (probabilities of various Fed interest rate moves) 4/24: 1% chance of a rate HIKE) and ZERO % chance of a rate cut
. . . https://www.cmegroup.com/markets/interest-rates/cme-fedwatch-tool.html
The Table -------- TUESDAY 4/28/26 -----
The S&P 500 closed Tuesday April 28 at 7139, down 0.5% for the day,
and up 23.4% from the 5783 election day closing level,
and up 19.0% from the inauguration eve closing level,
and up 21.4% since the December 31, 2024 close
and up 4.3% Year-To-Date (since the December 31, 2025 close)
The Dow closed Monday at 49,168, and it closed Tuesday at 49,142, a drop of 0.1% (26 points) for the day
ALL TIME HIGHS
The S&P 500's all-time closing high was 6978.6 on January 27 until surpassed April 15
The DOW's all-time closing high was 50,188 reached on February 10
The NASDAQ's all-time closing high was 23,857 reached on January 28 until surpassed in April
Market news of the day: https://finance.yahoo.com/
How to find the latest Yahoo Finance "stock market today" report if it's not at the finance.yahoo page (note that the headline displayed there does not include the "Stock Market Today" words, but the article itself does): click on
https://www.google.com/search?q=%22stock+market+today%22+site%3Afinance.yahoo.com&oq=%22stock+market+today%22+site%3Afinance.yahoo.com
If the link doesn't work for you,
Google: "stock market today" site:finance.yahoo.com
First I will very briefly cover Monday (just the link to the article), then on to Tuesday 4/28
--
Monday April 27
S&P 500: +0.12%, , DOW: -0.13% (-63 points), , NASDAQ: +0.20%, ,
TREASURY 10Yr: 4.34% +0.03 , , Bitcoin: $76,945 @ 420p ET , , WTI OIL: $96.42 +2.14%
Stock market today: S&P 500, Nasdaq notch fresh records, oil edges higher as markets weigh Iran peace odds, Yahoo Finance, Monday 4/27/26
https://finance.yahoo.com/markets/stocks/live/stock-market-today-monday-april-27-232226050.html
--- SCROLLING DOWN THE ABOVE YAHOO FINANCE PAGE, MONDAY, APRIL 27 -----
--- OTHER ARTICLES, MONDAY, APRIL 27 -----
This is a little older. But since the PCE inflation report comes out this Friday April 30, I'll leave it here for awhile
Inflation complications: The unusual gap between PCE and CPI is widening, Barron's (no paywall at this MSN-hosted article), 4/22/26
https://www.msn.com/en-us/money/markets/inflation-complications-the-unusual-gap-between-pce-and-cpi-is-widening/ar-AA21rnrB
Tuesday April 28
S&P 500: -0.49%, , DOW: -0.05% (-26 points), , NASDAQ: -0.90%, ,
TREASURY 10Yr: 4.35% +0.02 , , Bitcoin: $76,376 @ 422p ET , , WTI OIL: $99.63 +3.38%
Stock market today: Dow, S&P 500, Nasdaq drop as chip stocks sink on OpenAI report, oil rises, Yahoo Finance, Tuesday April 28
https://finance.yahoo.com/markets/stocks/live/stock-market-today-tuesday-april-28-dow-nasdaq-sp-oil-rises-earnings-in-focus-225503557.html
US stocks slipped from record highs on Tuesday as OpenAI (OPAI.PVT) doubts weighed on tech stocks and the United Arab Emirates said it would leave the OPEC group of oil producers.
OpenAI has fallen short of its own targets for sales and users ahead of its highly anticipated IPO, the Wall Street Journal reported. Shares of partners such as Oracle (ORCL) slumped amid revived concerns about how long the AI spending boom will last.
Investors are now on high alert for clues to AI plans as the “Magnificent Seven” tech megacaps report quarterly results this week. Alphabet (GOOG), Amazon (AMZN), Meta (META), and Microsoft (MSFT) are on Wednesday’s docket, with Apple (AAPL) following the next day.
Meanwhile, the oil market is digesting news that the UAE is leaving the OPEC cartel, a move that deals a major blow to the bloc at an already historically precarious moment for Persian Gulf oil producers.
Wall Street is also watching for progress in peace talks, as the US-Iran standoff keeps traffic through the Strait of Hormuz at a standstill.
Brent crude (BZ=F) traded near $104 per barrel, while US WTI crude (CL=F) hovered near $100.
Also in focus, the Federal Reserve begins its two-day meeting on Tuesday. Policymakers are expected to hold rates steady in their decision on Wednesday, and investors will listen out for Fed Chair Jerome Powell’s comments as his term draws to a close.
--- SCROLLING DOWN THE ABOVE YAHOO FINANCE PAGE, TUESDAY, APRIL 28 -----
I have another time constraint situation, so I'm skipping this, unfortunately, since there are invariably a number of interesting articles
--- OTHER ARTICLES, TUESDAY, APRIL 28 -----
THESE SHOULD BE PUT IN THE REPORTS AND CALENDAR SECTION, BUT FOR NOW THEY ARE HERE
These are 3 reports that came out Tueday April 28, 2026
# Consumer confidence (Conference Board) :
https://finance.yahoo.com/economy/policy/article/consumer-confidence-ticks-higher-as-better-vibes-on-job-market-take-hold-144621322.html
Consumer confidence in April reached its highest level so far this year, according to a survey from the Conference Board.
The overall consumer confidence index climbed to 92.8 in April, up from March’s reading of 92.2 ... perceptions of the labor market improved (in the wake of the reported 178,000 net jobs added in March)
ULTIMATE SOURCE: https://www.conference-board.org/topics/consumer-confidence/
GRAPH:

It was a tiny uptick when you look at it on a graph.
# ADP PULSE -- ADP's weekly estimate of private sector job growth.
https://www.adpresearch.com/
Find the "The NER Pulse" section near the top, and click on Read More, resulting in:
https://www.adpresearch.com/the-power-of-mom-and-pops/
Scroll down the page for a graph
For the four weeks ending April 11, 2026, U.S. private employers added an average of 39,250 jobs a week ((which, when "monthesized" is a monthly rate of 170,541 -progree). It's slightly less than it was the week ending (W.E.) March 28 and also the week ending April 4 ( W.E. March 28 is the peak of the graph going back to W.E. Jan 24; W.E. March 28 is a bit over 40,000 from the graph). W.E. April 04 is slightly less that W.E. March 28. So there was a substantial downward revision from the initial W.E. April 4 report of an extraordinarily large 54,750 jobs a week (a 237,889 / month pace).
ADP is a private payroll processor that processes about 20% of the U.S. private payroll, and they estimate the other 80%. It is not a government report.
# S&P Case Shiller home price index (20 cities) February: +0.9% Y-O-Y (January was +1.2%). For the month, February was +0.44%.
https://www.spglobal.com/spdji/en/index-family/indicators/sp-cotality-case-shiller/
https://www.spglobal.com/spdji/en/index-family/indicators/sp-cotality-case-shiller/#indices
========EVERYTHING BELOW THIS POINT IS AS IT WAS FRIDAY APRIL 24, SORRY=======
I have time constraints today.
========EVERYTHING BELOW THIS POINT IS AS IT WAS FRIDAY APRIL 24, SORRY=======
=============================================
=============================================
=============================================
=============================================
REPORTS AND CALENDAR
Recent and Coming Up, Reports
https://www.marketwatch.com/economy-politics/calendar
See Reply #1 to this thread for last week's reports and older reports.
The government reports are all seasonally adjusted, as are most, if not all, of the non-government reports the media covers, so please don't post comments about how the numbers look good (or not as bad as expected) only because of Christmas season hires or Christmas shopping. Or that it's warming up and people are beginning spring shopping already -- seasonal factors like that have been adjusted for
THIS WEEK'S REPORTS/CALENDAR (Apr 20-24) FOLLOWED BY NEXT WEEK'S CALENDAR (Apr 27-May 1)
LAST WEEK'S REPORTS (APR 13 - 17)
@@@@@@@@@@@@@@@@@@@@@@@@@@@@@@@@@@@@@@@@@@@@@@@@@@@@@@@@@@@
These are all in Reply #1 in reverse chronological order. In a break from past practice, I am no longer putting last week's reports in this OP.
THIS WEEK'S REPORTS and CALENDAR (APR 20 - 24)
@@@@@@@@@@@@@@@@@@@@@@@@@@@@@@@@@@@@@@@@@@@@@@@@@@@@@@@@@@@
https://www.marketwatch.com/economy-politics/calendar
MONDAY APRIL 20 (REPORTS)
None scheduled
TUESDAY APRIL 21 (REPORTS)
#Record surge in gasoline receipts boosts US retail sales in March Reuters, 4/21/26
https://www.msn.com/en-us/money/markets/record-surge-in-gasoline-receipts-boosts-us-retail-sales-in-march/ar-AA21orii
(((March: +1.7%, February: +0.7%, 12 months: +4.0% -progree))
((Retail sales are not inflation-adjusted, so sometimes most or all and then some of the increase is due to the increase in prices -progree))
((CPI inflation: March: +0.9%, February: +0.3%, 12 months: +3.3%. So this time retail sales actually exceeded price increases. Simply subtracting the inflation from the retail sales increase, the after-inflation retail sales increases are roughly: March: +0.8%, February: +0.4%, 12 months: +0.7%. Kind of weak for 12 months -progree ))
Though higher prices partly accounted for the largest gain in sales in a year, the report from the Commerce Department on Tuesday supported economists' expectations that economic growth picked up in the first quarter after nearly stalling in the final three months of 2025. But the U.S.-Israel war with Iran is casting a shadow over the economic outlook.
February was revised up from +0.6% to 0.7%.
The Middle East conflict has sent global oil prices jumping more than 30%, with data from the U.S. Energy Information Administration showing retail gasoline prices soared 24.1% in March. . . .
Consumer Price Index increased 0.9% in March, with gasoline being the main driver of higher inflation.
The average tax refund was up $351 through March 27 compared to the same period in 2025, Internal Revenue Service data showed. The Treasury Department estimated that the average tax refund would be $1,000 higher compared to 2024.
From the Source: https://www.census.gov/retail/index.html -- > https://www.census.gov/retail/sales.html :
. . . Advance Retail Sales: Retail Trade and Food Services (Month-over-month) (MARTSMPCSM44X72USN), Not Seasonally Adjusted:
. . . . . . https://fred.stlouisfed.org/series/MARTSMPCSM44X72USN
. . . Advance Retail Sales: Retail Trade and Food Services (Month-over-month) (MARTSMPCSM44X72USS), Seasonally Adjusted:
. . . . . . https://fred.stlouisfed.org/series/MARTSMPCSM44X72USS
. . . Advance REAL Retail Sales: Retail Trade and Food Services (Month-over-month) Seasonally Adjusted -- I have not found this yet, until someone does, one has to calculate using the index values in series RRSFS below.
. . . Advance Retail Sales: Retail Trade and Food Services (RSAFS) (index values), seasonally adjusted
. . . . . . https://fred.stlouisfed.org/series/RSAFS
. . . Advance REAL Retail and Food Services Sales (RRSFS) (i.e. inflation adjusted) (index values), seasonally adjusted
. . . . . . https://fred.stlouisfed.org/data/RRSFS
# ADP Pulse: For the four weeks ending April 4, 2026, U.S. PRIVATE employers added an average of 54,750 jobs a week. It was the fifth straight week of improvement in hiring. These numbers are preliminary and could change as new data is added
Multiplying by 52.14/12 to "monthesize it" to the average month: 237,889
(There are 52.14 weeks in a 365-day year, and 12 months).
The ultimate source: https://www.adpresearch.com/
It has a graph (scroll down half a page) showing it was about 15,000/week in mid-February -- https://www.adpresearch.com/the-rise-and-rise-of-knowledge-work/
(ADP is a private payroll processor that process about 20% of the U.S. private payroll, and they estimate the other 80%)
# Business inventories February, actual: +0.4%, expected: +0.3%, previous: +0.0%
# US pending home sales beat expectations in March, Reuters, 4/21/26
https://www.msn.com/en-us/money/markets/us-pending-home-sales-beat-expectations-in-march/ar-AA21otG8
The pending home sales index rose 1.5% last month to 73.7, the National Association of Realtors said on Tuesday.
Pending home sales dropped 1.1% from a year earlier.
The popular 30-year fixed mortgage rate averaged 6.38% at the end of March, data from mortgage finance agency Freddie Mac showed. It had averaged 5.98% at the end of February, just before the war started, as Freddie Mac and Fannie Mae expanded purchases of mortgage-backed securities.
The NAR reported last week that existing home sales fell to a nine-month low in March.
A survey last week showed homebuilder sentiment plummeted to a seven-month low in April, noting that "energy costs make up approximately 4% of residential construction material input and service costs."
WEDNESDAY APRIL 22 (REPORTS)
None scheduled
THURSDAY APRIL 23 (REPORTS)
# Initial jobless claims week ending April 18, actual: 214,000, expected: 210,000, previous: 207,000
Reuters: +6,000 to 214,000 week ending 4/18. Continuing claims: +12,000 to 1.821M for the week ending 4/11. https://finance.yahoo.com/economy/articles/us-weekly-jobless-claims-increase-124003060.html
* SOURCE URL: The CURRENT one is always at: https://www.dol.gov/ui/data.pdf
This report's permalink: https://www.dol.gov/newsroom/releases/eta/eta20260423
* Permalinks for the current one and recent previous ones: https://www.dol.gov/newsroom/releases
. . . and search the page for "Unemployment Insurance Weekly Claims Report"
* The source URL has graphs, so one can see the trend over a year
Not-to-forget factoid from last week's report:
Reuters, 4/16/26 - https://finance.yahoo.com/news/us-weekly-jobless-claims-decline-123856207.html
***The so-called continuing claims have dropped from last year's lofty levels likely in part due to people exhausting their eligibility for benefits, limited to 26 weeks in most states. The data does not include some unemployed young workers, who typically have a limited or no work history. The job market for this group remains challenging.
# S&P flash U.S. services PMI April, actual: 51.3, expected: 51.0, previous: 49.8
(anything below 50 means contraction)
# S&P flash U.S. manufacturing PMI April, actual: 54.0, expected: 52.5, previous: 52.3
[S&P Global Flash] US business activity expands while prices rise most since 2022, Bloomberg, 4/23/26 == https://www.msn.com/en-us/money/markets/us-business-activity-expands-while-prices-rise-most-since-2022/ar-AA21ySEl
US business activity picked up in April, fueled by the strongest manufacturing growth in nearly four years as war-related supply disruptions prompted a scramble for supplies.
The S&P Global flash composite index rose 1.7 points to a three-month high of 52, data released Thursday showed. Figures above 50 indicate expansion. A measure of prices charged by manufacturers and service providers accelerated to the highest level since mid-2022.
. . . The Iran war also led to greater supply constraints for factories, with lead times on supplier deliveries stretching to the longest since August 2022 and materials costs accelerating. The measure of input prices for manufacturers grew at the fastest rate in nearly a year.
Businesses are quickly passing those costs along, as the composite measure of selling prices increased to 59.9, the highest since July 2022.
“Not surprisingly, prices are already spiking higher in this environment, and not just for energy but for a wide variety of goods and services. The overall inflation picture is now the most worrying for almost four years,” said Williamson.
Meanwhile, service sector activity recovered from last month's contraction, though remains subdued. A measure of new business slid to a two-year low.
FRIDAY APRIL 24 (REPORTS)
# Consumer sentiment (FINAL) April,
# Consumer sentiment final reading (49.8 in April) - has a graph -- Consumer sentiment at record low as Americans feel impact of war in Iran, Yahoo Finance, 4/24/26
https://finance.yahoo.com/news/consumer-sentiment-at-record-low-as-americans-feel-impact-of-war-in-iran-142920073.html
# LBN thread on consumer sentiment - https://www.democraticunderground.com/10143655889
The title of the thread says it's near a 4-year low, but they (Reuters via U.S. News) later changed the title to say it was at a record low.
https://money.usnews.com/investing/news/articles/2026-04-24/us-consumer-sentiment-drops-to-near-four-year-low-in-april
NEXT WEEK'S CALENDAR (APR 27-May 1)
@@@@@@@@@@@@@@@@@@@@@@@@@@@@@@@@@@@@@@@@@@@@@@@@@@@@@@@@@@@
https://www.marketwatch.com/economy-politics/calendar
The Fed's interest rate decision is Wednesday April 29
Thursday April 30 is busy with the PCE inflation (the Fed's favorite inflation gauge), personal income and expenditures, Q1 GDP 1st estimate, leading economic indicators, and unemployment insurance claims,
MONDAY, APRIL 27 (CALENDAR)
None scheduled
TUESDAY, APRIL 28 (CALENDAR)
9:00 am S&P Case-Shiller home price index (20 cities) February, Previous: 1.2%
10:00 am Consumer confidence April, Expected: 89.1, Previous: 91.8
WEDNESDAY, APRIL 29 (CALENDAR)
8:30 am Durable-goods orders March, Expected: 0.5%, Previous: -1.4%
8:30 am Durable-goods minus transportation March, Previous: 0.8%
8:30 am Housing starts (delayed report) February, Expected: 1.35 million, Previous: 1.49 million
8:30 am Building permits (delayed report) February, Previous: 1.38 million
8:30 am Housing starts March, Expected: 1.38 million --
8:30 am Building permits March, Expected: 1.39 million --
8:30 am Advanced U.S. trade balance in goods March, Previous: 83.5 billion
8:30 am Advanced retail inventories March, -- Previous: 0.2%
8:30 am Advanced wholesale inventories March, -- Previous: 0.8%
2:00 pm FOMC interest-rate decision
THURSDAY, APRIL 30 (CALENDAR)
8:30 am Initial jobless claims April 25, Expected: 215,000, Previous: 214,000
8:30 am Employment cost index Q1, Expected: 0.9% Previous: 0.7%
8:30 am GDP Q1 Expected: 2.4%, Previous: 0.5%
8:30 am Personal income March, Expected: 0.3%, Previous: -0.1%
8:30 am Personal spending March, Expected: 0.9%, Previous: 0.5%
8:30 am PCE inflation index March, Expected: 0.7%, Previous: 0.4%
8:30 am PCE (year-over-year), Expected: 3.5%, Previous: 2.8%
8:30 am Core PCE index March, Expected: 0.3%, Previous: 0.4%
8:30 am Core PCE (year-over-year), Expected: 3.2%, Previous: 3.0%
9:45 am Chicago Business Barometer (PMI) April, -- Previous: 52.8
10:00 am U.S. leading economic indicators February, -- Previous: -0.1%
FRIDAY, May 1 (CALENDAR)
9:45 am S&P U.S. manufacturing PMI April, -- Previous: 55.7
10:00 am ISM manufacturing April, Expected: 52.9, Previous: 52.7
####### -.CAL #########
The full calendar: https://www.marketwatch.com/economy-politics/calendar
Revised release dates for Bureau of Labor Statistics reports: https://www.bls.gov/bls/2025-lapse-revised-release-dates.htm
BEA.GOV news release schedule (they produce reports on the GDP, Retail Sales, PCE Inflation (the Fed's favorite inflation gauge), and Personal Consumption and Income: https://www.bea.gov/news/schedule
ADP NER Pulse (private payrolls weekly update): Is every Tuesday. The ultimate source: https://www.adpresearch.com/
and look for "NER Pulse"
Archives of previous reports
The monthly payroll employment reports from the BLS are archived at Archived News Releases (https://www.bls.gov/bls/news-release/ ). In the list up at the top, under Major Economic Indicators, select Employment Situation ( https://www.bls.gov/bls/news-release/empsit.htm ) . That opens up links to reports going back to 1994. (Includes CPI, ECI, many others)
Unemployment insurance claims archives: https://oui.doleta.gov/unemploy/claims.asp . If that doesn't work, start with https://oui.doleta.gov/unemploy/claims_arch.asp and click on "Weekly Claims Data" near the very bottom.
BEA's Data Archive https://www.bea.gov/news/archive
=============================================
=============================================
=============================================
=============================================
The S&P 500 closed Friday April 24 at 7165, up 0.8% for the day, to a new all-time high
and up 23.9% from the 5783 election day closing level,
and up 19.5% from the inauguration eve closing level,
and up 21.8% since the December 31, 2024 close
and up 4.7% Year-To-Date (since the December 31, 2025 close)
# Election day close (11/5/24) 5783
# Last close before inauguration day: (1/17/25): 5997
# 2024 year-end close (12/31/24): 5882
# Trump II era low point (going all the way back to election day Nov5): 4983 on April 8
# 2025 year-end close (12/31/25): 6845
# October 28 all-time-high: 6890.90, surpassed by December 24's all-time high of 6932.00 surpassed by ...
# Several market indexes: https://finance.yahoo.com/
# S&P 500: https://finance.yahoo.com/quote/%5EGSPC/
https://finance.yahoo.com/quote/%5EGSPC/history/
# S&P 500 futures: https://finance.yahoo.com/quote/ES%3DF/
Bitcoin
Bitcoin ended 2024 at $93,429. https://finance.yahoo.com/quote/BTC-USD/
Bitcoin's all-time interday high: 126,198 on Oct. 6
Bitcoin's all-time closing high: 124,753 on Oct 6. (that's what Yahoo Finance shows, but cryptocurrencies trade 24/7)
https://finance.yahoo.com/quote/BTC-USD/history/
========================================================
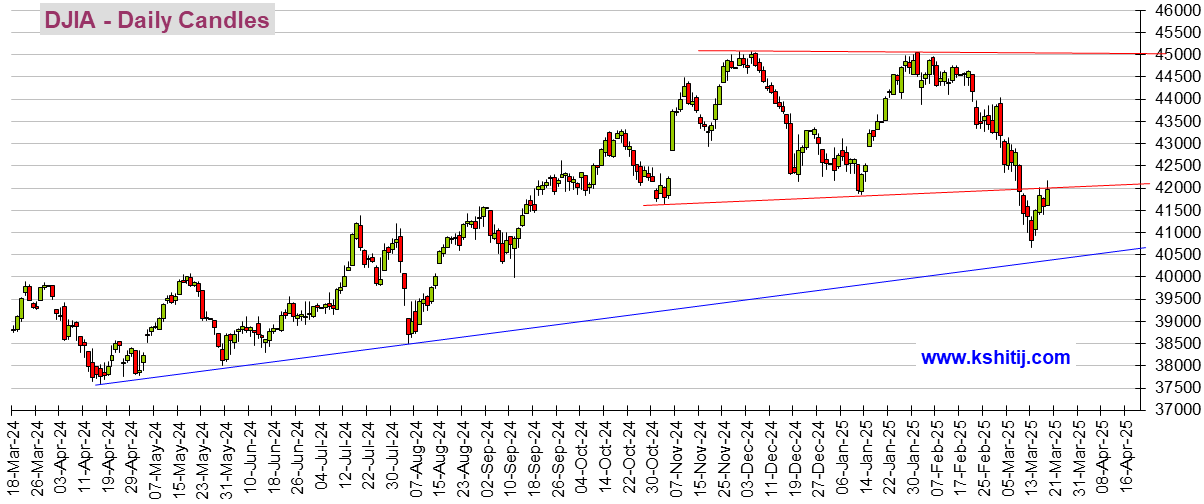
I'm not a fan of the DOW as it is a cherry-picked collection of just 30 stocks that are price-weighted, which is silly. It's as asinine as judging consumer price inflation by picking 30 blue chip consumer items, and weighting them according to their prices. But since there is an automatically updating embedded graphic, here it is. It takes several, like 6 hours, after the close for it to update, like about 10 PM EDT.
(If it still isn't updated, try right-clicking on it and opening in a new tab. #OR# click on https://finance.yahoo.com/quote/%5EDJI/ ).
The Dow closed Thursday at 49,310, and it closed Friday at 49,231, a drop of 0.2% (80 points) for the day
https://finance.yahoo.com/
DOW: https://finance.yahoo.com/quote/%5EDJI/
. . . . . . https://finance.yahoo.com/quote/%5EDJI/history/
DOW
# Election day close (11/5/24) 42,222
# Last close before inauguration day: (1/17/25): 43,488
# 2024 year-end close (12/31/24): 42,544
# 2025 year-end close (12/31/25): 48,063
DJIA means Dow Jones Industrials Average. It takes about 6 hours after the close to update, so check it after 10 PM EDT. Sometimes it takes a couple days (sigh)
I don't have an embeddable graph for the S&P 500, unfortunately, but to see its graph, click on https://finance.yahoo.com/quote/%5EGSPC/
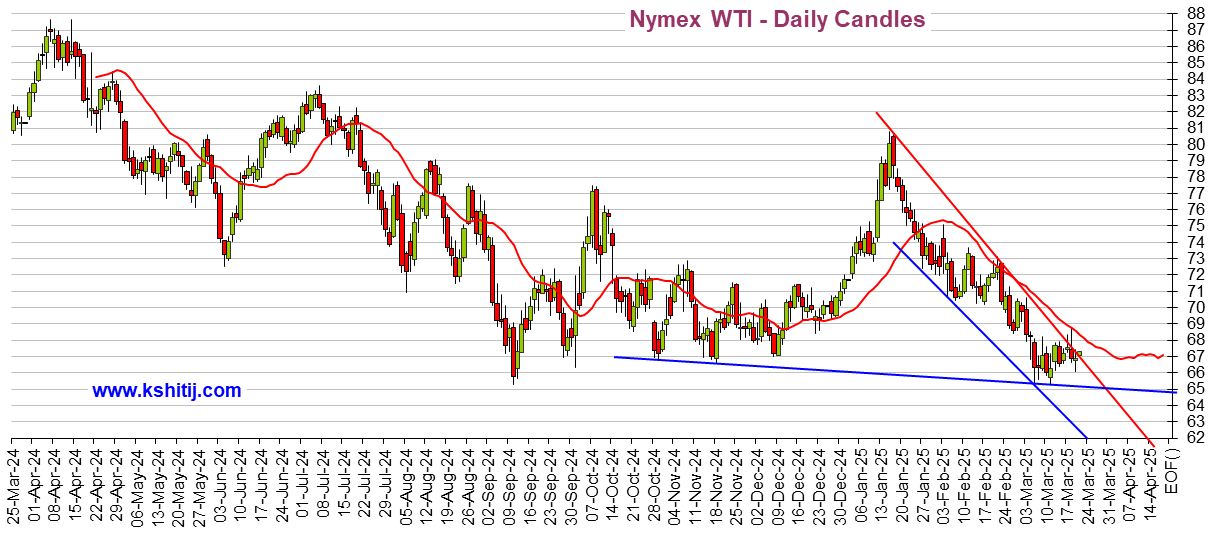
While I'm at it, I might as well show Oil and the Dollar:
Crude Oil
US Dollar Index (DX-Y.NYB)
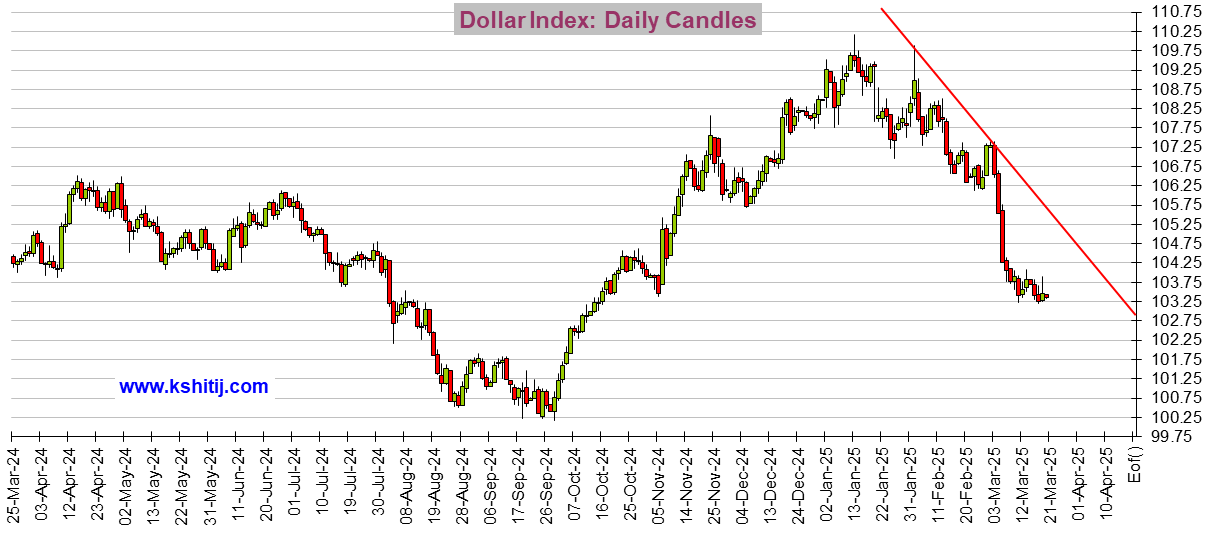
If you see a tiny graphics square above and no graph, right click on the square and choose "load image". There should be a total of 3 graphs. And remember that it typically takes about 6 hours after the close before these graphs update.
🚨 ❤️ 😬! 😱 < - - emoticon library for future uses
21 replies
 = new reply since forum marked as read
Highlight:
NoneDon't highlight anything
5 newestHighlight 5 most recent replies
= new reply since forum marked as read
Highlight:
NoneDon't highlight anything
5 newestHighlight 5 most recent replies
= new reply since forum marked as read
Highlight:
NoneDon't highlight anything
5 newestHighlight 5 most recent replies
SP500 closed Tue. 5/26 at 7519 up 0.6% to a new ATH. # Consumer Confidence dipped, ADP Pulse came out Wednesday [View all]
progree
Mar 2025
OP
Kicking: update for Thurs. March 6 close. The "Trump Trade" is back underwater after losing 1.8% for the day (S&P 500)
progree
Mar 2025
#2
Kicking: Update: S&P 500 closed Friday at 5770, up 0.5% for the day but still below the election day close
progree
Mar 2025
#3
Update: S&P 500 closed Monday 3/10 at 5615, down 2.7% for the day and 2.9% below the election day close
progree
Mar 2025
#4
Update: S&P 500 closed Tuesday 3/11 at 5572, down 0.8% for the day, briefly fell into correction territory
progree
Mar 2025
#5
S&P 500 closed Wednesday 3/12 at 5599, up 0.5% for the day, but down 3.2% since election day
progree
Mar 2025
#6
Update: S&P 500 closed Thursday at 5522, down 1.4% for the day, and MORE THAN 10% down from the all-time high
progree
Mar 2025
#7
Update: S&P 500 closed Friday at 5639, up 2.1% for the day, and down 2.5% since election day
progree
Mar 2025
#8
Update: S&P 500 closed Monday at 5675, up 0.6% for the day, and down 1.9% since election day
progree
Mar 2025
#9
Update: S&P 500 closed Tuesday at 5615, down 1.1% for the day, and down 2.9% since election day
progree
Mar 2025
#10
S&P 500 closed Tuesday 3/25 at 5777, up 0.2% for the day, down 0.1% since election day, down 6.0% from ATH
progree
Mar 2025
#11
S&P 500 closed Wednesday 4/02 at 5671, up 0.7% for the day, down 1.9% since election day, down 7.7% from ATH
progree
Apr 2025
#12